Genomics Inform Search

CLOSE


Genomics Inform > Volume 20(1); 2022 > Article
Yang and Park: TcellInflamedDetector: an R package to distinguish T cell inflamed tumor types from non–T cell inflamed tumor types

Abstract

A major issue in the use of immune checkpoint inhibitors is their lack of efficacy in many patients. Previous studies have reported that the T cell inflamed signature can help predict the response to immunotherapy. Thus, many studies have investigated mechanisms of immunotherapy resistance by defining the tumor microenvironment based on T cell inflamed and non–T cell inflamed subsets. Although methods of calculating T cell inflamed subsets have been developed, valid screening tools for distinguishing T cell inflamed from non–T cell inflamed subsets using gene expression data are still needed, since general researchers who are unfamiliar with the details of the equations can experience difficulties using extant scoring formulas to conduct analyses. Thus, we introduce TcellInflamedDetector, an R package for distinguishing T cell inflamed from non–T cell inflamed samples using cancer gene expression data via bulk RNA sequencing.

Introduction

Cancer cells express programmed death ligand 1 as a signal related to T cell unresponsiveness. Immunotherapies targeting immune checkpoints (e.g., anti–cytotoxic T lymphocyte associated antigen-4 and anti–programmed death-1 antibodies) are a standard component of care for patients with advanced cancers. Immune checkpoint inhibitors (ICIs) have led to improvements in the survival rate, but only a subset of patients respond to ICIs. Recent studies have reported that the efficacy of ICIs in cancer patients is determined by the T cell inflamed tumor microenvironment [1-3]. The molecular mechanisms of resistance have not yet been elucidated in detail. Nevertheless, previous studies have reported scoring methods for distinguishing non–T cell inflamed from T cell inflamed tumors based on gene expression data [4,5].
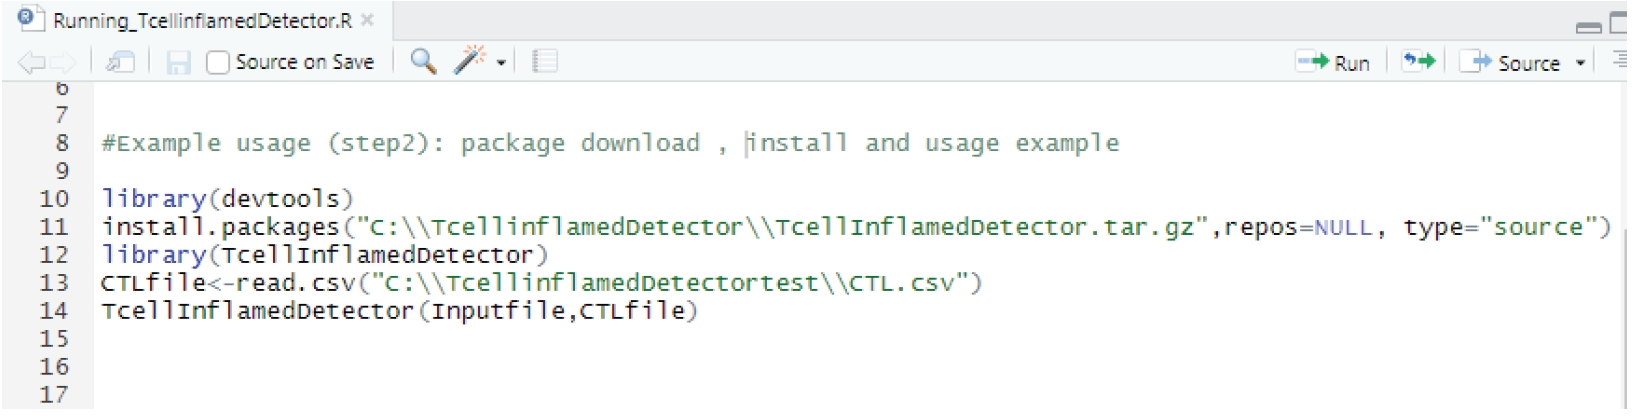
Unfortunately, general researchers who are unfamiliar with the detailed calculations involved in the equations can experience difficulties using these scoring formulas to conduct analyses. For this reason, we recently developed TcellInflamedDetector, an R package that predicts T cell inflamed tumors when given RNA-sequencing expression data. This package will be beneficial to optimize the selection of patients predicted to benefit from ICIs. TcellInflamedDetector implements the equation developed by Spranger et al. [5] to differentiate non–T cell inflamed and T cell inflamed tumor subtypes.

Input Data and Processing

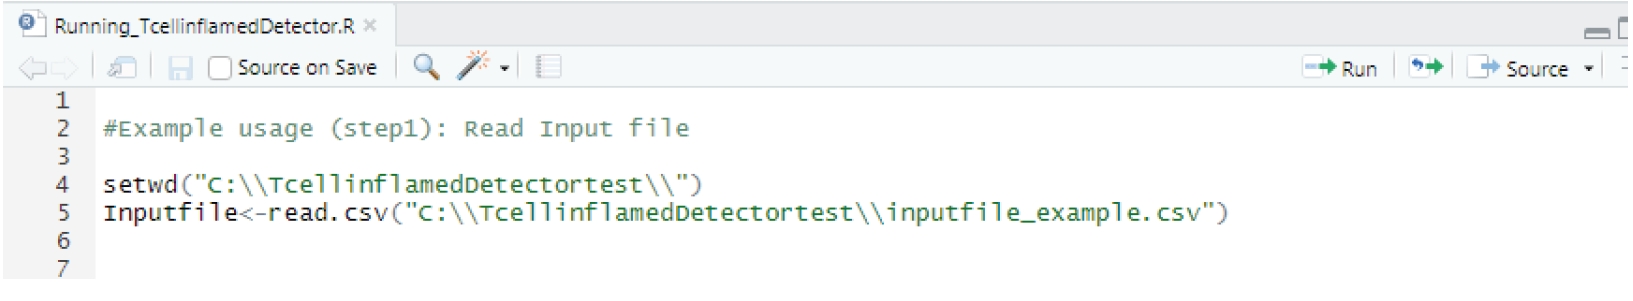
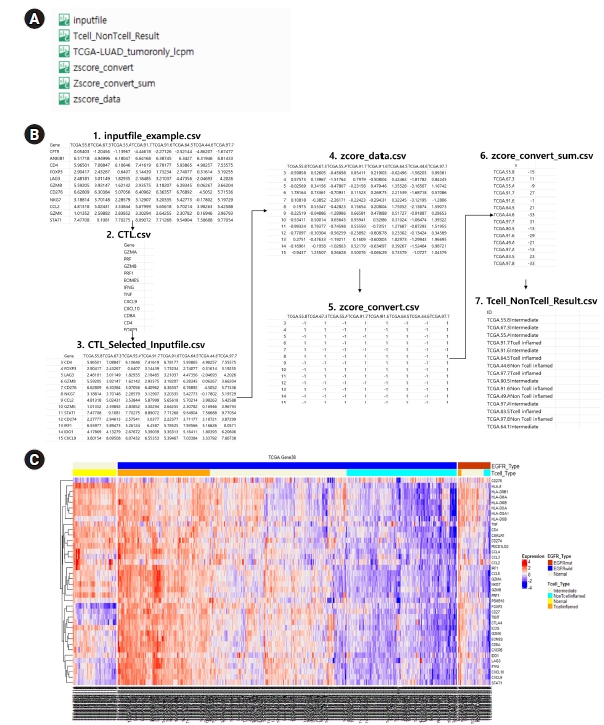
As shown in Fig. 1, TcellInflamedDetector requires RNA-sequencing count input data with genes and sample identifiers. Users follow the steps for data processing that are summarized in the TcellInflamedDetector manual on GitHub [6]. The input CSV file is RNA sequencing log count per million (CPM) data. The count matrix file is converted by EdgeR aveLogCPM() and the calcNormFactor function using the trimmed mean of the m-values method. Users can extract previously established gene signatures indicative of a T cell inflamed tumor microenvironment, which include the cytotoxic T lymphocyte (CTL) signature genes CD8A, CD8B, GZMA, GZMB, and PRF1 using R code [7-10]. The established gene signatures were referenced with the Gajewski T cell-inflamed signature, interferon-gamma related signature, T cell effector signature, and immune cytolytic activity signature [4,5].

Estimating T Cell Inflamed and Non–T Cell Inflamed Samples

As shown in Fig. 2, gene expression values were converted to a score Si = µi ± βiσi (i = 1, 2, … n), where µ and σ represent the mean and standard deviation (SD) of the ith gene’s expression across all samples, n is the total number of genes, β represents the distance between the ith gene’s expression in a sample and the mean in units of the SD (equivalent to a z-score). The threshold for non–T cell inflamed and T cell inflamed tumors was β0 = 0.1. The algorithm is described in detail below:
If the z-score value βi is greater than the threshold (β0 = 0.1), then +1 is assigned. Otherwise, if the z-score value βi is less than the threshold (β0 = 0.1), then ‒1 is assigned. If the sum of the column of genes with assigned values is greater than half of the number of CTL genes, then the output is a classification of “T cell inflamed.” If the sum of a column of genes with assigned values is less than half of the number of CTL genes, then the classification is “non–T cell inflamed.” Otherwise, the sample is classified as “intermediate.”
Users of the R package can obtain results in the format of a .csv file that contains data on the classification of samples as T cell inflamed, non–T cell inflamed, and intermediate. If users want to modify the CTL gene list when running the R package, they do not have to modify the complex R code. Instead, they can simply revise the gene list contained in the CTL.csv file.

Output

Five output formats are available: CTL_Selected_Inputfile.csv, Tcell_NonTcell_Result.csv, zscore_convert.csv, Zscore_convert_sum.csv, and zscore_data.csv. Fig. 3 presents examples of the prediction results of T cell inflamed, intermediate, and non–T cell inflamed groups. Users can check the expression patterns of specific genes through a heatmap. We also confirmed that T cell inflamed samples showed high expression of T cell effector gene signatures [10].
Finally, we conducted a test to demonstrate our tool’s flexibility; we tested it on The Cancer Genome Atlas (TCGA) lung adenocarcinoma RNA-sequencing dataset available through the TCGA Research Network [11]. Each sample was labeled according to the TCGA barcode, which contained gene names. Our package successfully selected subsets of gene expression data from the raw count data. Thus, TcellInflamedDetector can be beneficial for future cancer immunotherapy vaccine developers and researchers.

Notes

Authors’ Contribution

Conceptualization: SDY, HSP. Data curation: SDY, HSP. Methodology: SDY, HSP. Writing - original draft: SDY, HSP.

Conflicts of Interest

No potential conflict of interest relevant to this article was reported.

Availability

Availability: The R package TcellInflamedDetector is available on the Comprehensive Archive Network and on GitHub. It is distributed under the GNU General Public License. GitHub: (https://github.com/sandukyang/Tcellinflamed/blob/main/TcellInflamedDetector.tar.gz).

Acknowledgments

This research was partially supported by Kyung Hee Cyber University.

Fig. 1.
An exemplary code for extraction of T cell effector gene subset.
gi-22005f1.jpg
Fig. 2.
An exemplary usage of R code.
gi-22005f2.jpg
Fig. 3.
(A) An input file and generated output files. (B) Processing diagram for T cell inflamed function prediction. (C) T cell inflamed annotation of Heatmap expression in The Cancer Genome Atlas (TCGA) lung adenocarcinoma (LUAD) samples.
gi-22005f3.jpg

References

1. Jiang P, Gu S, Pan D, Fu J, Sahu A, Hu X, et al. Signatures of T cell dysfunction and exclusion predict cancer immunotherapy response. Nat Med 2018;24:1550–1558.
crossref pmid pmc
2. Trujillo JA, Sweis RF, Bao R, Luke JJ. T cell-inflamed versus non-T cell-inflamed tumors: a conceptual framework for cancer immunotherapy drug development and combination therapy selection. Cancer Immunol Res 2018;6:990–1000.
crossref pmid pmc
3. Gajewski TF, Corrales L, Williams J, Horton B, Sivan A, Spranger S. Cancer immunotherapy targets based on understanding the T cell-inflamed versus non-T cell-inflamed tumor microenvironment. Adv Exp Med Biol 2017;1036:19–31.
crossref pmid pmc
4. Luke JJ, Bao R, Sweis RF, Spranger S, Gajewski TF. WNT/beta-catenin pathway activation correlates with immune exclusion across human cancers. Clin Cancer Res 2019;25:3074–3083.
crossref pmid pmc
5. Spranger S, Luke JJ, Bao R, Zha Y, Hernandez KM, Li Y, et al. Density of immunogenic antigens does not explain the presence or absence of the T-cell-inflamed tumor microenvironment in melanoma. Proc Natl Acad Sci U S A 2016;113:E7759–E7768.
crossref pmid pmc
6. TcellInflamedDetector Manual. San Francisco: GitHub, 2021. Accessed 2022 Jan 15. Available from: https://github.com/sandukyang/Tcellinflamed/wiki.

7. Ayers M, Lunceford J, Nebozhyn M, Murphy E, Loboda A, Kaufman DR, et al. IFN-gamma-related mRNA profile predicts clinical response to PD-1 blockade. J Clin Invest 2017;127:2930–2940.
pmid pmc
8. Spranger S, Bao R, Gajewski TF. Melanoma-intrinsic beta-catenin signalling prevents anti-tumour immunity. Nature 2015;523:231–235.
crossref pmid
9. Herbst RS, Soria JC, Kowanetz M, Fine GD, Hamid O, Gordon MS, et al. Predictive correlates of response to the anti-PD-L1 antibody MPDL3280A in cancer patients. Nature 2014;515:563–567.
crossref pmid pmc
10. Shah S, Ward JE, Bao R, Hall CR, Brockstein BE, Luke JJ. Clinical response of a patient to anti-PD-1 immunotherapy and the immune landscape of testicular germ cell tumors. Cancer Immunol Res 2016;4:903–909.
crossref pmid pmc
11. Wang Z, Jensen MA, Zenklusen JC. A practical guide to the cancer genome atlas (TCGA). Methods Mol Biol 2016;1418:111–141.
crossref pmid
TOOLS
Share :
Facebook Twitter Linked In Google+
METRICS Graph View
  • 0 Crossref
  • 0 Scopus
  • 2,912 View
  • 161 Download
Related articles in GNI


ABOUT
ARTICLE CATEGORY

Browse all articles >

BROWSE ARTICLES
FOR CONTRIBUTORS
Editorial Office
Room No. 806, 193 Mallijae-ro, Jung-gu, Seoul 04501, Korea
Tel: +82-2-558-9394    Fax: +82-2-558-9434    E-mail: kogo3@kogo.or.kr                

Copyright © 2024 by Korea Genome Organization.

Developed in M2PI

Close layer
prev next