Introduction
Gastric cancer (GC) is the second leading cause of cancer-related mortalities worldwide, especially in Asian countries. In South Korea, the incidence of GC was the highest in 2017 and GC ranked fourth among the causes of cancer-related deaths [1-4]. Despite advances in therapeutics, recurrence occurs in about half of the patients, and the prognosis of recurrent and metastatic GC is very poor [5-7]. Thus, new therapeutic strategies involving for tumor-specific molecular targets are critically needed to improve the outcome of recurrent and metastatic GC patients. Paclitaxel, which is one of the most commonly used standard chemotherapeutic drugs, binds to ╬▓-tubulin and stabilizes microtubules, resulting in G2/M arrest and cell death. Various targeted anticancer agents were tested in combination with paclitaxel as second-line therapy for advanced GC [8-11]. However, most combinations, except that with ramucirumab, failed to show improved efficacy [12]. Moreover, mechanisms underlying paclitaxel activity, except mitosis inhibition, have not yet been studied well. Elucidating these mechanisms is important for the selection of appropriate combination partners of paclitaxel.
Epigenetic dysregulation is a common feature of cancer, including GC. Eventually, it contributes to GC development and progression [13]. In our previous study, iBET-151, an inhibitor of the bromodomain and extraterminal (BET) protein, which is an epigenetic regulator, was found to function effectively in GC cells (unpublished data). A recent study reported that lowering the expression of B-cell lymphoma (BCL)-2 and BCL-xL, the targets of the BET protein, induces sensitivity to paclitaxel [14]. We confirmed that paclitaxel and iBET-151 exerted synergistic effects in GC cells by investigating cell viability and migration and the cell cycle (unpublished data). However, to determine the detailed synergistic mechanisms of paclitaxel and iBET-151, it is necessary to identify the overall changes in the transcriptome and associated pathways.
RNA sequencing (RNA-seq), via next-generation sequencing, is very useful for differential expression analysis involving specific conditions, such as ŌĆśdrug treatment versus no-treatment.ŌĆÖ Therefore, researchers can comprehensively report the gene expression changes related to drug treatment by performing RNA-based genome-wide profiling [15].
In this study, we performed RNA-seq to analyze the differentially expressed genes (DEGs) observed following treatment with paclitaxel, iBET-151, and their combination in GC cells. We also identified the biological and functional pathways associated with DEGs using the Gene Ontology (GO) and Kyoto Encyclopedia of Genes and Genomes (KEGG) databases to determine the possible action mechanisms of BET monotherapy and BET-paclitaxel combination treatment.ŌĆā
Methods
Cell line and cell culture
AGS GC cell line (CRL-1739) was obtained from the American Type Culture Collection (ATCC, Manassas, VA, USA). AGS cells were cultured in Eagle's Minimum Essential Medium supplemented with 10% fetal bovine serum (Lonza, Basel, Switzerland) and 1├Ś penicillin/streptomycin (Lonza). All experiments were performed after AGS cells reached the exponential growth phase.
Drugs
A small-molecule inhibitor of the BET family, iBET-151, was purchased from Selleckchem (Houston, TX, USA) and prepared as a 10-mM stock solution in DMSO (Sigma-Aldrich, St. Louis, MO, USA). Paclitaxel, an anti-mitotic drug, was purchased from Sigma-Aldrich.
RNA-seq data analysis
For differential expression analysis by RNA-seq, total RNA was isolated from iBET-151- or/and paclitaxel-treated or untreated AGS cells using the RNeasy Mini Kit (Qiagen, Hilden, Germany), according to the manufacturer's instructions. RNA quantity and integrity were assessed using both Nanodrop and Bioanalyzer, according to the manufacturerŌĆÖs instructions. Library preparation and RNA-seq was performed using the Illumina TruSeq RNA Library Preparation Kit (Illumina, San Diego, CA, USA), according to the manufacturerŌĆÖs protocol. Samples were sequenced on the Illumina NovaSeq 6000, 150 bp paired-end reads, to a minimum depth of 120 million reads per sample. Sequenced reads were aligned to the hg19 genome assembly using TopHat2. Differential expression analysis was processed following the Tuxedo protocol. DEGs were defined based on the cutoff values of p Ōēż 0.05, false discovery rate < 0.05, and fold change (FC) > 1.5. The reference annotation based on Ensembl release 69 (ftp://ftp.ensembl.org/pub/release-69/gtf/macaca_mulatta).
Functional enrichment analysis
GO annotation enrichment analysis was performed using The Database for Annotation, Visualization, and Integrated Discovery (DAVID) (v6.8), an online tool applied for functional annotation analysis and Gene Set Enrichment Analysis using MSigDB. GO and KEGG pathway analyses provide a comprehensive set of functional annotation tools for identifying characteristic biological attributes of high-throughput genome or transcriptome data.
Western blot analysis
To study the effect of drugs on protein expression, tissues and cells were lysed in RIPA buffer (50 mM Tris [pH 8.0], 150 mM NaCl, 1% NP-40, 0.1% sodium dodecyl sulfate, 1 mM EDTA, 10% glycerol) containing protease and phosphatase inhibitors (Roche Diagnostics, Laval, QC, Canada). The cell lysates were subjected to sodium dodecyl sulfate polyacrylamide gel electrophoresis and western blotting. Membranes were then developed using an enhanced chemiluminescence (ECL) reagent (GE Healthcare, Piscataway, NJ, USA). ╬▒-tubulin was used as a loading control. Antibodies used for western blotting included antiŌĆÆepidermal growth factor receptor (EGFR), antiŌĆÆfibroblast growth factor receptor (FGFR)-3, and antiŌĆÆinsulin-like growth factor-1 receptor (IGF-1R; Cell Signaling Technology, Beverly, MA, USA); antiŌĆÆhuman epidermal growth factor receptor (HER)-2, antiŌĆÆHER-3, and anti-MET (Santa Cruz Biotechnology, Santa Cruz, CA, USA); anti-╬▒-tubulin (Sigma-Aldrich); and horseradish peroxidase-conjugated secondary anti-rabbit and anti-mouse (Jackson ImmunoResearch Laboratories, West Grove, PA, USA) antibodies. Membranes were then developed using the ECL reagent (GE Healthcare), and ╬▒-tubulin was used as a loading control. Quantification was performed with a Molecular Imager ChemiDoc XRS+ Imaging System (Bio-Rad, Hercules, CA, USA)
Statistical analysis
Graphing was performed using GraphPad Prism software version 8 (Graph Pad Software Inc., San Diego, CA, USA). All statistical analyses were performed using SPSS version 25 (IBM Corp., Armonk, NY, USA). All the significance levels were set at p Ōēż 0.05, and all p-values were two-sided.
Results
DEGs induced by iBET-151, paclitaxel, and combination treatments
In our previous study, we confirmed that iBET-151-paclitaxel combination treatment exerted a synergistic effect on cell viability and invasion in several cell lines (unpublished data). To understand the effects of iBET-151 and paclitaxel on the whole transcriptome better, we performed RNA-seq of AGS cells that were most affected by the synergistic effects of iBET-151 and paclitaxel to compare the global gene expression profiles of untreated and iBET-151-, paclitaxel-, and iBET-151ŌĆÆpaclitaxel combination-treated cells.
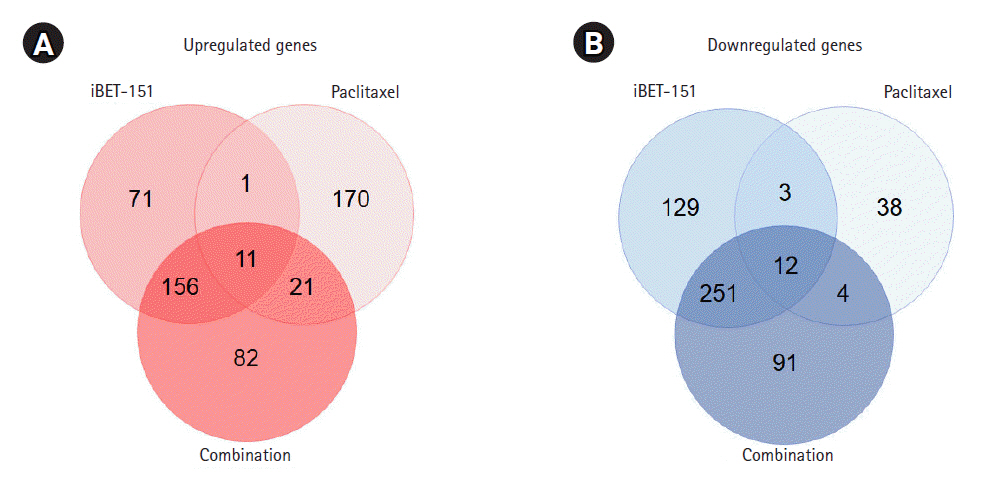
About 16,000 genes were selected after the preprocessing step, during which genes that were not detected in both treated and untreated AGS cells were excluded. Based on our DEG-specific criteria, we observed that iBET-151 upregulated 239 genes, whereas paclitaxel upregulated 203 genes (Fig. 1A). Upregulation of 270 genes by combination treatment was mainly due to the effect of iBET-151 treatment (Fig. 1A). Of the genes upregulated by iBET-151 alone, 61% (167/270) were upregulated by the combination of iBET-151 and paclitaxel. Thus, these genes were shared between the combination- and iBET-151ŌĆÆtreated cells.
Then, we observed that iBET-151 downregulated 395 genes, whereas paclitaxel downregulated 57 genes (Fig. 1B). In the combination-treated cells, 358 genes were downregulated; among them, 73% (263/358) overlapped with the downregulated genes in the iBET-151ŌĆÆtreated cells (Fig. 1B). However, the genes regulated by paclitaxel alone did not overlap with those regulated by iBET-151 alone or the iBET-151-paclitaxel combination. The top 10 genes upregulated and downregulated by iBET-151, paclitaxel, and combination treatments are shown in Tables 1 and 2, respectively.
GO functional enrichment analysis
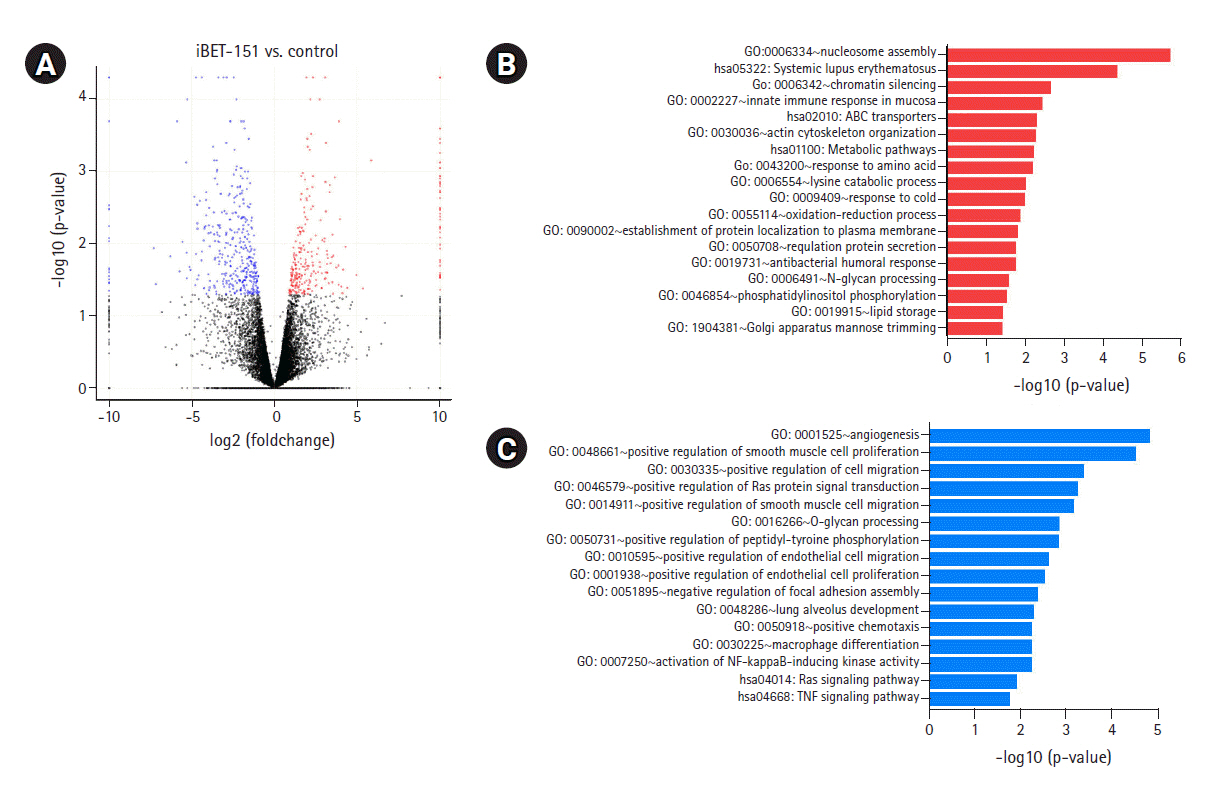
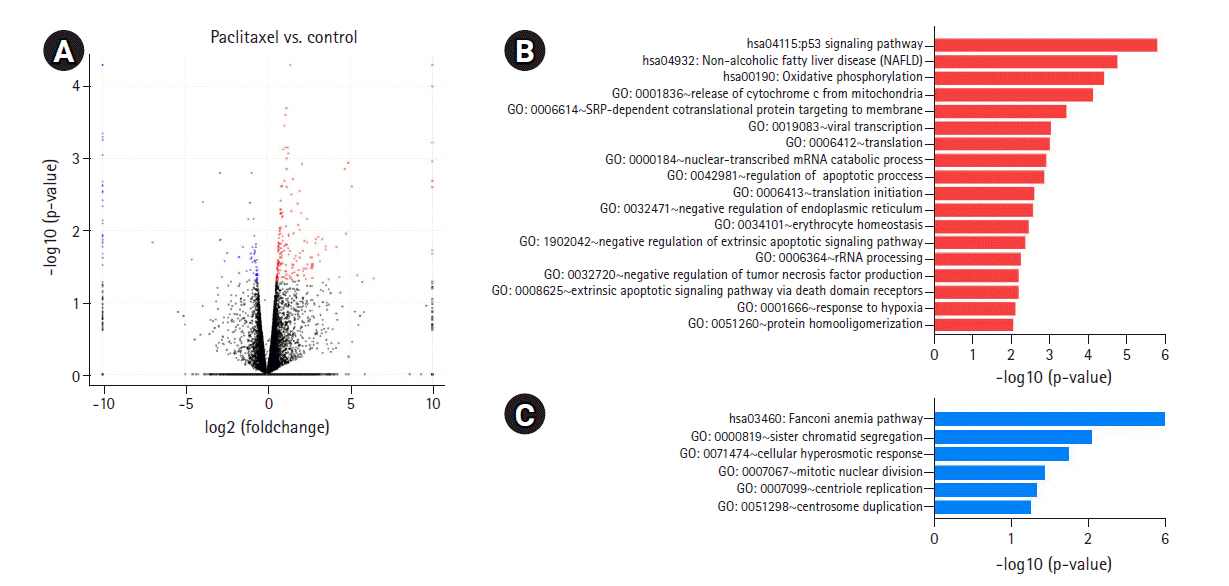
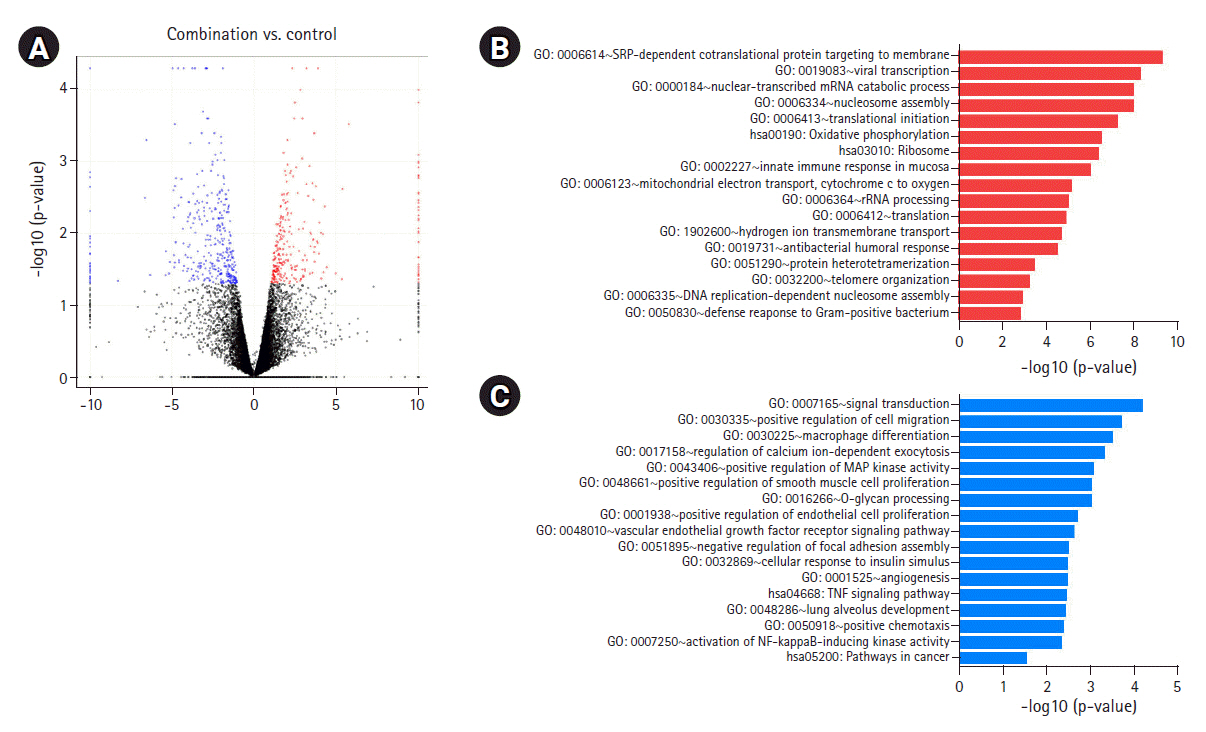
To determine the biological effects of gene expression changes, we performed GO analysis with the selected DEGs using DAVID v6.8. Volcano plots were used for the concurrent demonstration of both FC and p-value of DEGs in mono- or combination-treated cells (Figs. 2A, 3A, and 4A).
Interestingly, GO analysis showed that upregulated genes in iBET-151ŌĆÆtreated cells were most enriched in the chromatin silencing, nucleosome assembly pathways, and DNA packing complex (Fig. 2B, Supplementary Fig. 1A). This was because iBET-151 suppressed the epigenetic regulatory function of the BET family and affected chromatin remodeling. The genes downregulated by iBET-151 were enriched in angiogenesis; cell migration; RAS protein signal transduction; positive regulation of extracellular signal-regulated kinase (ERK)-1 and ERK cascade; positive regulation of transcription, DNA-templated; and negative regulation of apoptotic process (Fig. 2C, Supplementary Fig. 1B).
In paclitaxel-treated cells, the upregulated genes were enriched in the apoptotic signaling pathway; release of cytochrome c from mitochondria; regulation of apoptotic process; and mitochondrial electron transport, cytochrome c to oxygen (Fig. 3B, Supplementary Fig. 1C). Genes downregulated by paclitaxel were enriched in sister chromatid segregation, mitotic nuclear division, and centrosome duplication (Fig. 3C, Supplementary Fig. 1D). According to a recent study [16], paclitaxel inhibited mitosis by binding to microtubules and regulating mitosis-related pathways, including mitotic nuclear division, chromosome segregation, and G2/M transition of the mitotic cell cycle, in lung cancer cells. The results of our previous study on lung cancer cells showed that paclitaxel upregulated mitosis-related pathways, including mitotic nuclear division and chromosome segregation (unpublished data).
GO analysis showed a significant increase in the upregulation of the same genes involved in the aforementioned pathways in combination-treated cells. Moreover, an increase in the upregulation of genes involved in reactive oxygen species metabolic process and nucleotide-excision repair, DNA damage recognition was observed after combination treatment (Fig. 4B, Supplementary Fig. 1E). We observed that downregulated genes in the combination- and iBET-151-treated cells were enriched in overlapping GO terms, including angiogenesis, positive regulation of RAS protein signaling, cell migration, MAP kinase activity, and positive regulation of signaling; however, a significant decrease in gene expression was observed between the combination- and mono-treated cells (Fig. 4C, Supplementary Fig. 1F).
Significantly altered genes in combination-treated cells, compared with that in mono-treated cells
To understand the effects of combination treatment better, we identified genes that were more significantly upregulated or downregulated in combination-treated cells than in mono-treated cells. We first identified the genes with FC > 1.5 and p < 0.05 in combination-treated cells, compared with in control cells. We then identified the DEGs with FC > 1.5 in the respective mono-treated cells.
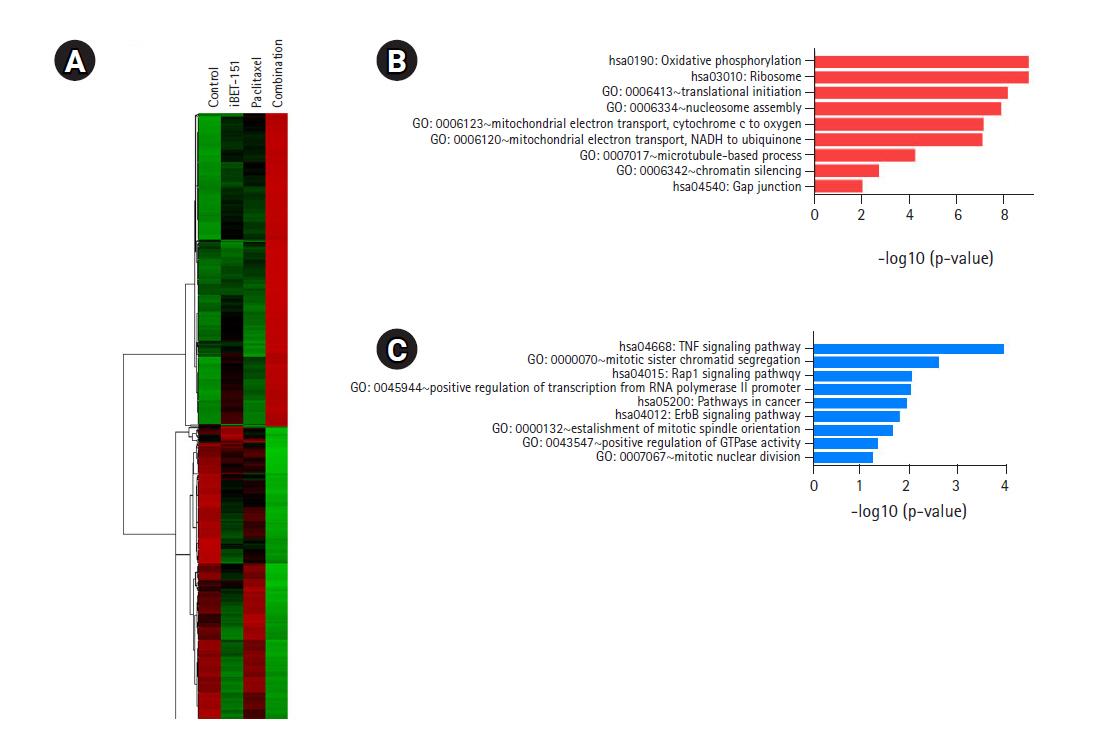
We identified 460 DEGs, including 238 upregulated and 222 downregulated DEGs, in AGS cells based on the above-mentioned cutoff values. As shown in Fig. 5A, the heatmap of hierarchical clustering of 460 DEGs demonstrated clear discriminating patterns. Then, GO analysis demonstrated that combination treatment upregulated genes enriched in nucleosome assembly, mitochondrial electron transport, and microtubule-based process (Fig. 5B). Subsequent GO analysis after combination treatment showed downregulation of genes involved in mitotic sister chromatid segregation, positive regulation of transcription, positive regulation of GTPase activity, and mitotic nuclear division (Fig. 5C).
Most of these results after combination treatment were similar to those obtained after iBET-151 or paclitaxel mono-treatment. However, combination treatment induced more changes in the genes than those in case of either of the mono-treatments.
Expression of BET protein target genes and major receptor tyrosine kinase
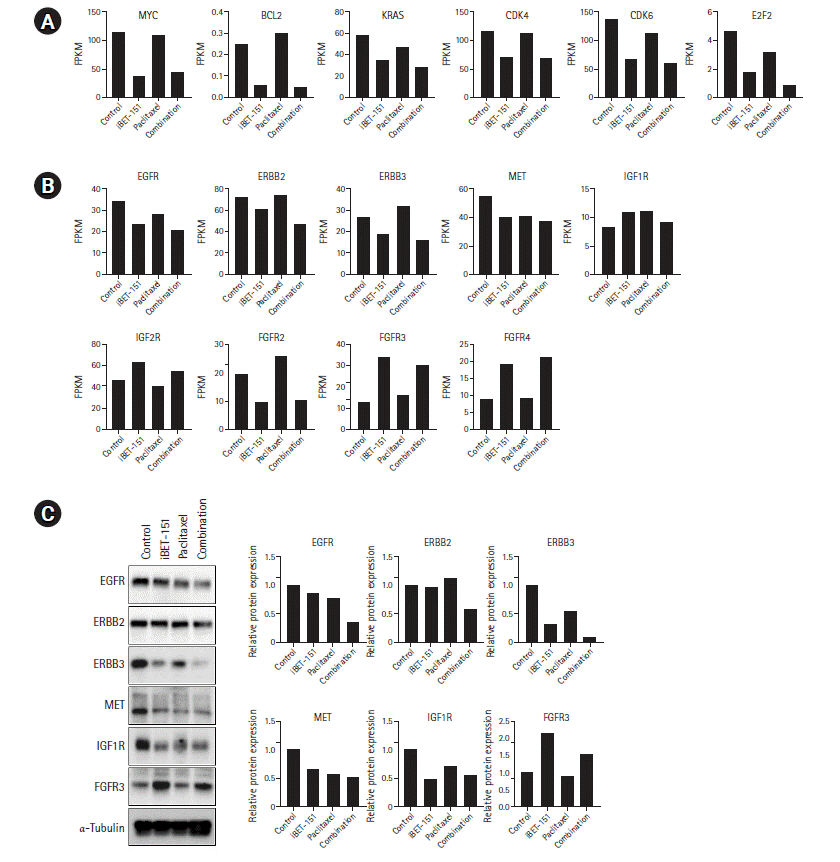
Next, we determined the mRNA expression levels of BET protein target genes. We observed that iBET-151 reduced the mRNA expression of the oncogenes, MYC and KRAS, and the anti-apoptotic gene, BCL-2. However, no change was observed in the expression of these genes on paclitaxel treatment, as expected (Fig. 6A).
In our previous study, we found that iBET-151 induced G1 cell cycle arrest (unpublished data). Consistent with this result, the expression of cyclin dependent kinase-4/6 and E2F transcription factor-2 involved in G1-S phase transition was reduced. To elucidate the underlying biology, we observed the changes in major receptor tyrosine kinase (RTK) expression. We confirmed that iBET-151 reduced the expression of RTK mRNA and proteins, including EGFR, ERBB3, MET, and IGF-1R, thereby regulating cancer cell growth and survival. Additionally, RTK expression was further reduced on iBET-151ŌĆÆpaclitaxel combination treatment. However, in the FGFR family, FGFR-3/4 was significantly increased on iBET-151 and combination treatments (Fig. 6B and 6C).
Discussion
In this study, we performed RNA-seq to identify the transcriptome changes induced by mono- and combined treatments with iBET-151 and paclitaxel in the AGS GC cell line. First, we confirmed that the expression of MYC and BCL-2, which is known as the target of BRD-4, was decreased on iBET-151 treatment, as expected. Interestingly, we observed that KRAS, an oncogene that plays a key role in the development and progression of various carcinomas, was downregulated in iBET-151-treated cells. Even though KRAS has been known as a significant driver in various cancers, it has long been considered undruggable. Interestingly, we confirmed that KRAS mRNA expression was reduced on iBET-151 treatment and further decreased on iBET-151ŌĆÆpaclitaxel combination treatment. This result suggested that iBET-151 could be developed as an indirect KRAS inhibitor for potential therapeutic effects in GC patients.
Additionally, we confirmed that expression of signal transduction-related genes, such as epidermal growth factor, vascular endothelial growth factor, IGF, and SRC, was also significantly decreased. On the other hand, expression of genes related to chromatin silencing and nucleosome assembly was increased on iBET-151 treatment. This was because the BET family proteins, the targets of iBET-151, are epigenetic regulators. Particularly, expression of sirtuin (SIRT)-4 involved in histone deacetylation was significantly increased. SIRT-4 is a tumor suppressor that is reduced in various carcinomas, and reduced SIRT-4 protein expression is associated with poor prognosis. It has also been reported that SIRT-4 interferes with glutamine metabolism and inhibits cell proliferation and migration [17]. As mentioned in our previous study, the metabolism pathway is enhanced in not only the iBET-151ŌĆÆsensitive group, but also various carcinomas (unpublished data). Therefore, we expected that increasing SIRT-4ŌĆÆinhibiting glucose pyruvate dehydrogenase using iBET-151 would be a feasible therapeutic strategy for these cancers.
Paclitaxel is a drug that binds to tubulin and stabilizes microtubules to suppress mitosis. However, our RNA-seq results revealed that paclitaxel also regulates expression of genes involved in cell division in GC. In this study, expression of genes related to sister chromatid segregation, mitotic nuclear division, and centrosome duplication was decreased in paclitaxel-treated GC cells. Additionally, expression of genes involved in cytochrome c release in mitochondria and apoptotic process was increased. This suggested that paclitaxel not only inhibited mitosis by binding to tubulin but also regulated mitosis inhibition and apoptosis in cell death by regulating related gene expression. Therefore, our study provides novel findings that may help in identifying appropriate combination drugs with paclitaxel for GC treatment via determination of gene expression changes induced by paclitaxel.
Additionally, we found that iBET-151 and paclitaxel separately reduced the expression of RTK, which is involved in key signaling pathways (RAS/mitogen-activated protein kinase and phosphoinositide 3-kinase/AKT pathways) that regulate cancer cell proliferation.
Trastuzumab is approved for use as HER-2ŌĆÆtargeted therapy for various cancers, including GC, to improve survival of patients with HER-2 amplification. However, in many cases, acquired resistance is induced by re-activation due to interaction with other RTKs, and this is related to poor survival. We found that iBET-151 reduced the expression of other RTKs, such as EGFR, HER-3, and MET, which are induce signaling activation by heterodimeric binding to HER-2. This expression is further decreased on iBET-151-paclitaxel combination treatment. Therefore, the combination of iBET-151 and paclitaxel can overcome resistance induced by HER-2-targeted treatment in GC.
JQ1, a BET inhibitor, has been recently reported to induce resistance by increasing FGFR protein expression in ovarian cancer [18] and uveal melanoma [19], but the underlying mechanism remains unclear. In our results, FGFR-3 protein expression was increased in GC, and RNA-seq showed that FGFR-3 and FGFR-4 mRNA expression was increased. Further research is needed to elucidate FGFR-3 regulation, but this makes it possible to find out that FGFR3 is regulated at the transcription level by the BET inhibitor. Therefore, our results show that not only JQ1 but also iBET-151 increased FGFR-3 expression, and in particular iBET-151 regulates FGFR3 at the mRNA level. Therefore, our results add evidence for combination therapy with BET inhibitor and FGFR inhibitor.
In our previous study, iBET-151 and paclitaxel exerted synergistic effects on GC cell proliferation and migration (unpublished data). Using RNA-seq analysis, we found that combination-treated cells showed higher changes in gene expression in the above-mentioned pathways than untreated and mono-treated cells. AGS cells showed the greatest reduction in angiogenesis-related expression of vascular endothelial growth factor-A, matrix metalloproteinase-14, and X-box-binding protein (XBP)-1 in response to combination treatment, compared with to either iBET-151 or paclitaxel single treatment. Particularly, XBP-1, a transcription factor, is known to promote not only angiogenesis, but also tumorigenesis, proliferation, and drug resistance.
In conclusion, we analyzed the biological functions induced by iBET-151-paclitaxel combination treatment. The results elucidated the biological mechanism underlying the synergistic effects of iBET-151 and paclitaxel. More research is needed in the future to determine the exact mechanisms underlying the action of these compounds, but we expect that the combination therapy of iBET-151 and paclitaxel will be a promising therapeutic strategy for GC.