Introduction
Improving efficiency is an important issue in new drug development. Although there have been considerable advances in science and technology, the number of approved new drugs per research spending has continuously declined over 60 years [1]. Dramatic improvements were made in pre-clinical research areas, but the successful clinical development rate of new drug candidates has not changed in recent years [1]. To improve efficiency in clinical trials, enrichment strategies were proposed in several disease areas, which enable precision medicine in drug development [2–4].
Various omics technologies have been used in recent clinical trials to elucidate the various characteristics of new drug candidates and to identify optimal subjects for the trials [5–10]. Pharmacogenomics is used in clinical trials to select appropriate patients and to further explain pharmacokinetics, pharmacodynamics, efficacy, and adverse drug reactions of new drug candidates [6–8]. Pharmacometabolomics can be used in clinical trials to identify drug targets, diagnosis disease, assess drug metabolic enzyme function in humans, and monitor the drug response and toxicity [9–13]. The importance of those evaluations is high in early phase clinical trials because it can help to simplify late phase clinical trials and increase the probability of success of clinical trials [5].
In this report, we present a case showing how pharmacogenomics and pharmacometabolomics were used in an early phase new drug development clinical trials. Drug X is a transient receptor potential vanilloid type 1 (TRPV1) antagonist class of new drug candidate that is under clinical development for the treatment of atopic dermatitis. In a first-in-human clinical trial for drug X, large inter-individual variability in the plasma concentration was observed after a single oral administration. Furthermore, moderate adverse drug reactions were observed in certain group of subjects. To perform subsequent clinical trials safely and efficiently, we needed to understand the cause of the inter-individual variability observed in the early phase clinical trial for drug X.
The aim of this study was to investigate the mechanism of the variability in plasma concentration of drug X and the adverse drug reaction by integrated multi-omics analysis using pharmacogenomics and pharmacometabolomics tools.
Methods
Study samples
The first-in-human clinical study enabled exploratory analysis of pharmacogenomics and pharmacometabolomic analysis. The study was approved by the Institutional Review Board of Seoul National University Hospital, Seoul, Korea (H-1011-027-339) and was conducted in accordance with the principles of the Declaration of Helsinki and ICH Good Clinical Practice. All subjects provided written informed consent before any study-related procedure was performed.
Whole blood samples (n = 32) were obtained from every subject who received a single oral dose of drug X for the pharmacogenomic genotyping. Plasma samples (n = 8) were obtained from the subjects who received highest dose of drug X for the pharmacometabolomic analysis.
Genotyping
Genomic DNA was extracted from the whole blood using a QIAamp DNA Mini Kit (QIAgen, Hilden, Germany). The pharmacogenomics screening was performed using an Affymetrix DMET (Drug-Metabolizing Enzymes and Transporters) Plus microarray (Affymetrix, Santa Clara, CA, USA) at DNA Link Co. Ltd. (Seoul, Korea) according to the previously described method [14]. The microarray covered 1,931 single nucleotide polymorphisms (SNPs) and small insertions/deletions (indels) and 5 copy-number variations for 255 genes involved in the metabolism, transport, and excretion of drugs in humans and its utility and robustness has been validated in previous reports [15, 16]. Furthemore, a real-time polymerase chain reaction (PCR) was performed using TaqMan SNP Genotyping Assays (Applied Biosystems, Foster City, CA, USA) to confirm the GSTM1 copy number variant identified from the microarray.
Pharmacometabolomic analyses
Metabolomic profiling to identify metabolites of drug X was performed in plasma samples using liquid chromatography (Agilent 1200 series, Agilent Technologies, Santa Clara, CA, USA) coupled with quadrupole time-of-flight mass spectrometry (Agilent 6530 Q-TOF MS, Agilent Technologies). To prepare the analyte, a 100 μL of plasma sample was mixed with 400 μL of acetonitrile. Five microliters of supernatant aliquot was injected onto the Agilent Zorbax C18 column (1.8 μm particle size, 2.1 × 50 mm; Agilent Technologies) at 30°C under gradient elution for 18 min. The mobile phase consisted of a mixture of 0.1% formic acid in 2 mM ammonium formate and 0.1% formic acid in acetonitrile. Positive ion electrospray ionization mode was used for mass spectrometry. The phase I and phase II metabolites of drug X were identified by molecular feature extraction of Agilent MassHunter Qualitative Software version B.03.01 (Agilent Technologies).
Data analysis
The pharmacokinetic parameters of drug X were analyzed by noncompartmental analysis and presented using descriptive statistics. The maximum plasma concentration (Cmax) and the area under the plasma concentration-time curve from 0 to the last measurable concentration (AUClast), which represents the systemic exposure to drug x, is summarized by genotype and dose groups. The apparent clearance (CL/F), which represents the capacity of drug elimination from the body, was pooled among the dose groups, and the Mann–Whitney U test was used to compare the CL/F between the genotype groups. A p-value of <0.05 was considered to be statistically significant. The number of drug-related adverse events (AEs) between the genotype groups was compared using the chi-square test and Fisher’s exact test. Statistical analyses were performed using SAS software version 9.3 (SAS Institute Inc., Cary, NC, USA).
Results
Subject classification and study flow
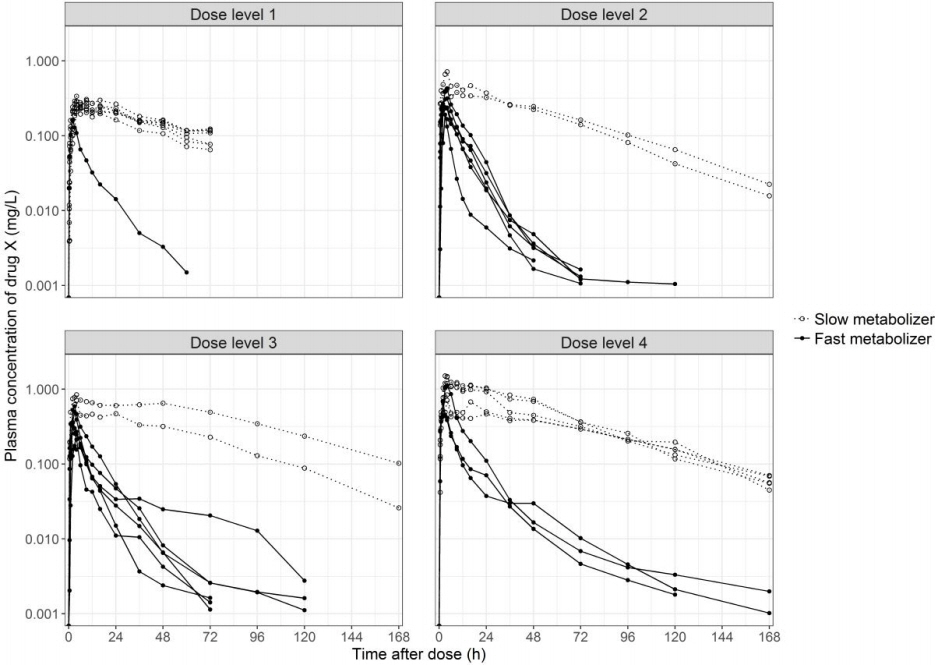
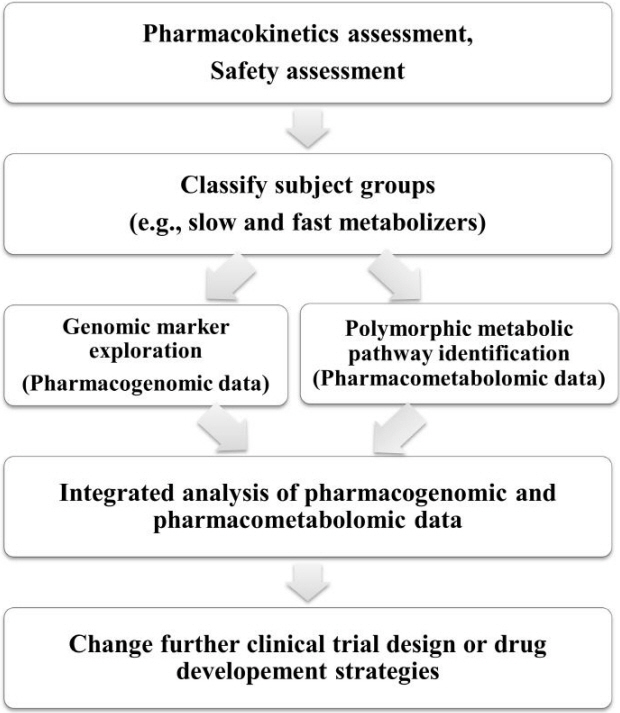
After pharmacokinetics and safety assessment of the original first-in-human clinical study, the subjects were clearly classified into two groups, namely, slow and fast metabolizers (Fig. 1). After the classification, genomic marker exploration was performed by pharmacogenomic analysis and metabolic pathway identification was performed by drug pharmacometabolomic analysis. The genomic marker data was integrated with metabolic pathway data to understand the mechanism of the inter-individual variability. The overall study flow is presented in Fig. 2.
Pharmacogenomics analysis results
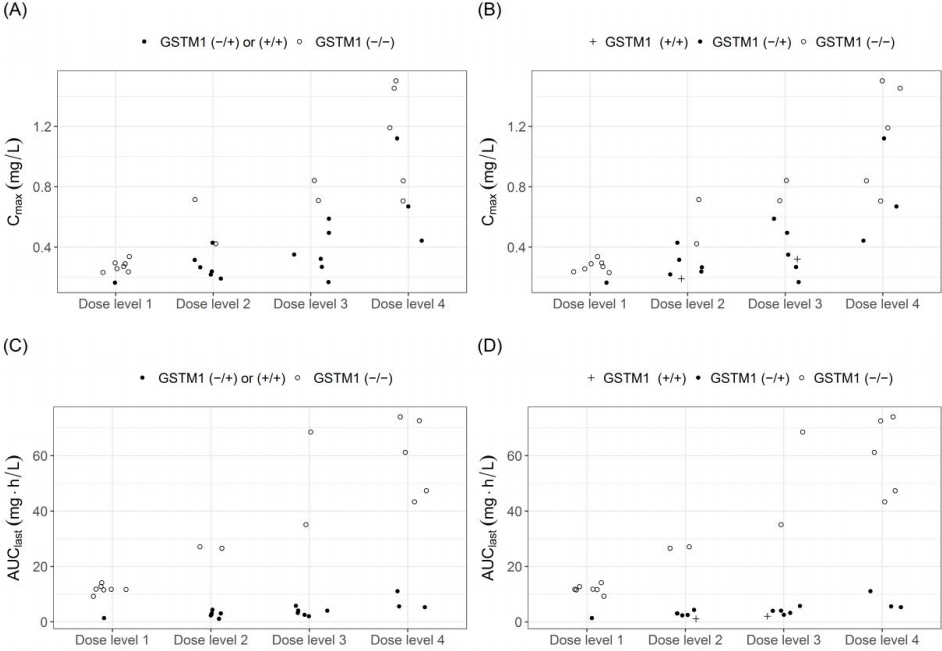
In the slow metabolizer subjects, homozygous deletion of the glutathione-S-transferase M1 gene (GSTM1 null), which leads to loss of enzyme function, was identified from the DMET Plus microarray. The systemic exposure to drug X, which is represented by the Cmax and the AUClast, was higher in GSTM1 null subjects than GSTM1 functional subjects in every dose group (Table 1, Fig. 2). The apparent drug clearance (CL/F) was 13-fold lower in GSTM1 null subjects than GSTM1 functional subjects (p < 0.001) (Table 1). The GSTM1 deletion polymorphism was confirmed using real-time PCR, and subjects with two functional GSTM1 alleles showed similar drug exposure to subjects with one functional GSTM1 allele (Fig. 3).
Pharmacometabolomic analyses result
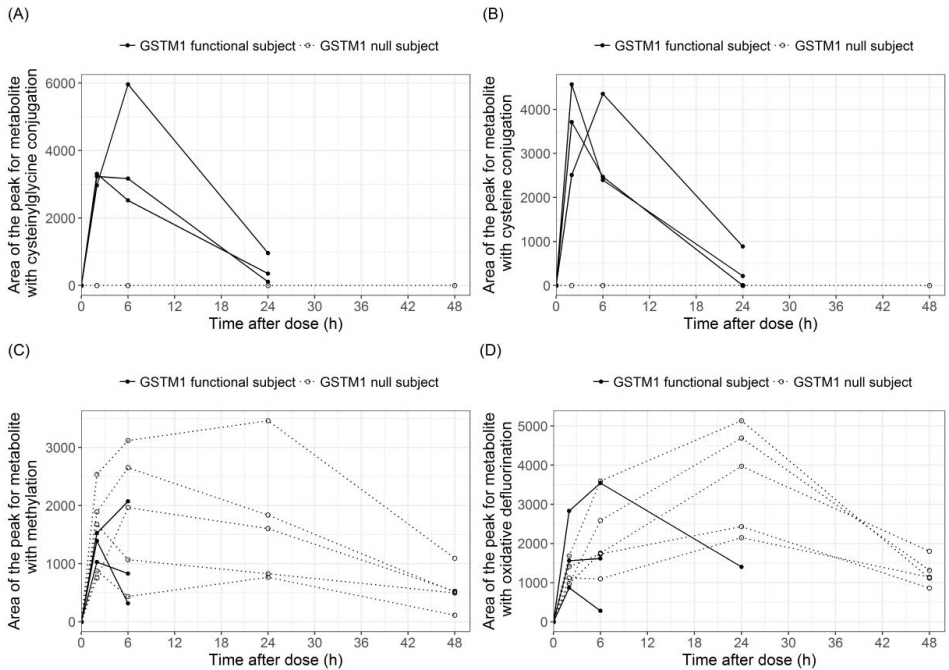
A total of four metabolites of drug X (cysteine conjugation, cysteinylglycine conjugation, methylation, oxidative defluorination) were observed from the plasma samples. Among these metabolites, cysteine and cysteinylglycine conjugation metabolites were detected in functional GSTM1 subjects, but they were absent in GSTM1 null subjects (Fig. 4). The areas under the peak for methylation and oxidative defluorination metabolites were higher in the GSTM1 null subjects than the functional GSTM1 subjects (Fig. 4).
GSTM1 null genotype and drug-related AE
The number of drug-related AEs and the number of subjects with drug-related AEs were higher in the GSTM1 null subjects than the GSTM1 functional subjects, although it failed to reach statistical significance (Table 2). Furthermore, the AEs were more severe in the GSTM1 null subjects than the GSTM1 functional subjects. Three subjects in the GSTM1 null group experienced AEs with moderate severity, whereas none in the GSTM1 functional group experienced those AEs. Those AEs were feeling hot, feeling cold and a burning sensation, and these sensations are frequently reported AEs in TRPV1 antagonist class drugs [17, 18].
Discussion
Through the integrated omics analysis, we could understand the reason for the inter-individual pharmacokinetic variability observed in the first-in-human trial for drug X. The GSTs are a group of phase II enzymes that play an important role in the biotransformation of various xenobiotic and endogenous compounds by conjugation with glutathione [19]. GSTM1 is a μ class isoform of GST, and the GSTM1 gene is highly polymorphic in humans. Homozygous deletion of the GSTM1 gene is observed in various ethnic groups, and its frequency ranged from 29.6% to 56.2% [20, 21]. The frequency of GSTM1 null subjects was 50% in this study, consistent with the previously reported GSTM1 null frequency in Koreans [20]. The loss of catalytic function is suggested to be reason for decreased systemic clearance of drug X in GSTM1 null subjects. This hypothesis was supported by the metabolite analysis showing that no cysteine conjugation or cysteinylglycine conjugation metabolites of drug X were observed in GSTM1 null subjects.
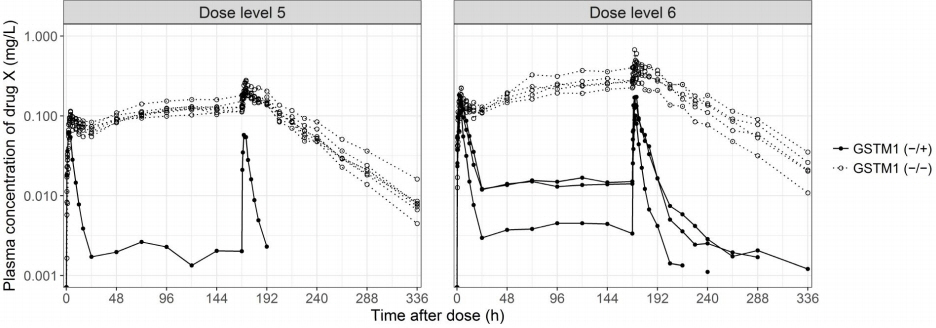
The effect of the GSTM1 null polymorphism on systemic exposure to drug X was reproduced in subsequent clinical trials. The GSTM1 null subjects showed higher plasma concentration and lower CL/F of drug X than functional GSTM1 subjects after multiple oral administrations (Table 3, Fig. 5). The clinical development strategy for drug X needed to be modified to reflect these results because the GSTM1 null variant was a major determining factor for drug exposure, as well as drug-related AEs, and because the frequency of GSTM1 nulls is approximately half of total population. A personalized drug development strategy applying different oral doses based on the GSTM1 genotype or switching to a different formulation with limited systemic exposure was needed for safe and efficient development of drug X. drug X is currently in clinical development as a topical formulation to limit systemic absorption.
Integrated multi-omics analysis can be a useful tool to evaluate the diverse characteristics of new drug candidates in clinical situations. The importance of integration of multi-omics data is growing in many research areas, including pharmaceutical research and development [22–24]. As shown in this case study, integrated multi-omics analysis can be used to explain the cause of inter-individual variability in drug exposure and adverse drug reactions observed in clinical development. This information can be important when making decisions for further drug development strategy.
In conclusion, integrated multi-omics analysis can be useful in early phase clinical trials for elucidating the various characteristics of new drug candidates that could not be produced through traditional clinical trial methods.