Introduction
The expression of functional product of a gene is a foundation of modern biotechnology. Sixty-one codons to translate 20 amino acids and three codons to stop translation are employed in the genetic code. These codons are deciphered in the ribosome by complementary tRNAs that are attached with the proper amino acids [1]. The degeneracy of the genetic code enables same protein to be translated by many alternate nucleotide sequences. The frequency of different codons varies significantly between different organisms, and also between highly and lowly expressed genes in the same organism. There is a continuing speculation regarding the factors which influence these codon preferences. Attempts have been made to explain the codon distributions in protein coding genes as well as the variations in codon usages as mutation-selection stability among different synonymous codons in each organism [2,3]. Researchers have assumed that codon bias which tends to diminish the diversity of isoacceptor tRNAs may decrease the metabolic load [4,5]. Whatever may be the reason behind codon usage bias, it has gradually developed the idea that codon bias can have a thoughtful influence on the expression of genes. The equilibrium between mutation and natural selection on translational efficiency is supposed to cause of codon bias [6,7] and stronger relative codon usage bias (RCB) in highly expressed genes than lowly expressed genes is anticipated due to the natural selection [8]. The recent technical advances e.g., cDNA microarray, Serial Analysis of Gene Expression (SAGE), etc. are large-scale, high-throughput experimental methods which need material and information processing systems to match. Furthermore, a massive investment of time and resources put an obstacle before the investigators. Thus, to identify the highly expressed genes in vast majority of organisms, researchers were looked beyond the direct experimental methods. So, predicting gene expression level using computational approaches rather than experimental is more interesting because it evades expensive and laborious experiment.
It is observed that highly expressed genes will preferably choose an optimal subset of codons identified by the most abundant tRNA and highly expressed genes are often depicted by strong codon usage bias [9,10,11,12,13,14,15,16]. Based on this hypothesis, a variety of gene expression measures like Codon Adaptation Index (CAI) [17], Relative Codon Adaptation (RCA) [18], Relative Codon Bias Strength (RCBS) [19,20,21] which compute codon usage bias in genes are currently in use, and hence provide numerical indices to predict the expression levels of genes. Calculation of CAI score depends on the knowledge of codon bias of highly expressed genes. However, the determination of set of highly expressed gene is major problem to calculate CAI and CAI is also relatively noisy in the short region to capture local codon bias pattern [22,23]. Although the determination of set of highly expressed gene is not required for calculating score of RCBS, but RCBS has partial dependence on gene length (for genes having length < 300 aa) [18]. Like CAI, RCA also depends on the knowledge of codon bias of highly expressed genes and it also depends on the size of the reference set because relative frequency is used to calculate relative adaptation of the codons [24,25]. In order to overcome the problems of partial dependence on gene length and determination of selective highly expressed genes as a reference set, we proposed here an alternative model (Modified Relative Codon Bias Strength [MRCBS]) to predict the expression levels of genes from their codon compositions. It has no length dependence on the gene size and uses codon usage of ribosomal protein (RP) genes which are believed to be highly expressed genes [11,12] as a reference set for our calculation. To measure the predictive performance of the methodology, we compared the performances of several commonly used measures in this work.
Here, we investigated the gene expression and the variation in patterns of synonymous codon usage across the crenarchaeal genomes. Crenarchaeota is one of the four phyla of Archaea and includes both cold-dwelling and hyperthermophilic prokaryotes. The cold-dwelling Crenarchaeota have been recognized only as community samples of 16S ribosomal RNA from the marine environments. The hyperthermophilic species of Crenarchaeota, some of which have the ability to grow at up to 113℃, have been isolated from geothermally heated soils, waters containing elemental sulfur and sulfides, or hydrothermal vents [26]. At higher temperatures, bioleaching rates of thermophilic organisms surpass their low temperature microbial counterparts and subsequently significant research interest grows to use of these organisms for biomining applications [27]. Cold-dwelling organisms survives extremely low temperature and uses antifreeze proteins (AFP) for their development and existence in subzero environments. AFPs can be applied in the field of aquaculture, agriculture, cryopreservation, cryosurgery, and food storage [28,29]. Metabolically, Crenarchaeota which are quite diverse and varying from chemoorganotrophs to chemolithoautotrophs, include anaerobes, facultative anaerobes or aerobes, and many of them employ sulfur in some way for energy metabolism [30]. Numerous species use carbon dioxide as only carbon source to produce organic matter, and procure energy by the oxidation of inorganic substances like sulfur and hydrogen, and reduction of sulfur or nitrate. Some species develop on organic substrates by aerobic or anaerobic respiration or by fermentation. The most remarkable property of the Crenarchaeota is their survival in the environment involving extremes of acidity and temperature.
These uncommon features of Crenarchaeota have fascinated the research interest of evolutionary biologists and biotechnology companies. The environment when first life emerged on the early Earth can be thought similar to the extreme conditions of the environment under which Crenarchaeota reside currently. This information proposes that first forms of life on earth may be similar to Crenarchaeota. Also, extreme resistance to heat and acid of cellular enzymes make Crenarchaeota very appealing to use in industry and research. Thus gene expression of crenarchaeal genomes is expected to make important contributions in several areas.
Methods
The whole genomes along with gene annotations were retrieved from NCBI GenBank. All sequences marked as coding sequences were considered, including those annotated as hypothetical and those predicted by computational methods only. In this study, we measured the expression pattern and codon usage of five crenarchaeal genomes namely, Aeropyrumpernix K1 (GenBank accession No. NC_000854), Hyperthermus butylicus DSM 5456 (GenBank accession No. NC_008818), Pyrobaculum aerophilum IM2 (GenBank accession No. NC_003364), Sulfolobus solfataricus P2 (GenBank accession No. NC_002754), and Sulfolobus tokodaii 7 (GenBank accession No. NC_003106). In the following sections, we have briefly described the different expression level predictors CAI, RCBS, RCA, GC3, and Impact Codon and developed an alternative approach using the score of MRCBS.
Codon Adaptation Index (CAI)
The CAI [17] measures the deviation of a given protein coding gene sequence with respect to a reference set of genes. It defines translationally optimal codons as those appear frequently in highly expressed genes. The CAI model assigns a parameter, termed ‘relative adaptiveness’ to each of the 61 codons (stop codons excluded). Relative adaptiveness (wi) is obtained by normalizing the frequency of each synonymous codons by the frequency of the most frequent codon. So, relative adaptiveness for most frequent codon is 1 and other codon is less than 1. The CAI of a gene is simply the geometric average of the relative adaptiveness of all codons in a gene sequence, and where fi is the frequency of codon i, and faa,max is the maximum frequency of the codon most often used for encoding amino acid aa in a set of highly expressed genes of the particular genome. N is the number of codons in the gene. CAI ranges from 0 to 1. The higher are the CAI values, the genes are more likely to be highly expressed.
Relative Codon Bias Strength (RCBS)
Relative Codon Adaptation (RCA)
Fox and Erill [18] proposed RCA that measures codon bias of a gene based on a set of highly expressed genes. RCA makes use of a given reference set to compute observed and expected codon frequencies. Relative adaptation for individual codon xyz is defined as Using this, RCA for entire gene is computed as where fxyz is the observed relative frequency of codon xyz in any reference gene set, fi(m) is the observed relative frequency of base m at codon position i in the same reference set and L is the length of the query sequence.
GC3
Highly expressed gene uses a set of optimal codons. These codons are biased to pyrimidines (i.e., C and T) ending at the third position. Shields [31] found that GC contents at silent sites were often correlated with gene expression. The base composition at silent sites measures the GC content at the third position of synonymous codons (GC3s) and can be used as an index of codon bias. It is the frequency of G or C nucleotides present at the third position of codons except non-degenerate codons (i.e., Met, Trp, and stop codons) where N = any base, S = G or C. and fxyz is the observed frequency of codon xyz.
Impact Codon
Das et al. [32] quantified the degree of codon bias by assigning an impact score (dxyzi) to each codon of a gene sequence, since it considers codon usage as well as the base compositional bias. Impact score is defined as where fxyz is the normalized codon frequency for the codon xyz and fn(m) is the normalized frequency of base m at codon position n in a gene. If X̄ and µ denote the sample mean and population mean of the impact score for a particular codon respectively; and σ the population standard deviation, then z score of a test statistics is given by where N is the total no of codons. The impact codons are then identified, based on the level of significance from the z score of test statistic. The scores of the impact codons differ markedly from the results expected in the absence of codon bias and it seems reasonable to assume that RCB in the highly expressed genes is strongly influenced by the presence of impact codons.
Modified Relative Codon Bias Strength (MRCBS)
The codon composition of genes fundamentally affects the protein translation. Our approach in estimating gene expression level is related to codon usage bias of a gene with respect to biased nucleotide composition at the three codon sites. Let fxyz be the observed normalized codon frequency for the codon triplet (x,y,z) in a particular reference set of gene and fn(m) is the relative observed frequency of base m at codon position n in the same reference set. Then, the RCB of a codon triplet (x,y,z) is defined as the ratio of observed frequency of a codon to the expected frequency under the hypothesis of random codon usage where the base compositions are biased at three sites as that in the reference set under study.
Thus the expression measure of MRCBS [24,25] of a gene is defined as where
RCBSaa,max is the maximum RCBS of codon encoding same amino acid aa in the same reference set, and N is the length in codons of the query sequence. MRCBSxyz is independent of the size of the reference set as it is the ratio of the RCBS of the codon xyz to the maximum of RCBS of codon encoding same amino acid. The value of MRCBS lies between 0 and 1.
In this study, the criteria MRCBS > T (threshold score) was taken as a benchmark for identifying the highly expressed genes and methodology used to calculate threshold score as described in Sahoo and Das [25]. Due to evolving codon assignments as well as codon usage patterns as the adaptive response of genomes, threshold score for identifying highly expressed genes varies from genome to genome. For calculating threshold score (T), we defined a parameterization set to evaluate how well CAI value correlates actual expression level predicted by MRCBS. First, we calculated the CAI of the all genes by taking all RP (> 80 aa) genes as predicted highly expressed genes (PHE) genes and called this as an evaluation set. Then taking an arbitrary threshold score T of MRCBS we differentiated highly expressed genes from lowly expressed genes. The highly expressed genes with expression level (MRCBS) greater than T define parameterization set. We calculated the CAI parameters taking parameterization set as reference set. With the parameters in hand, CAI values for all the genes in the data set were computed. In order to evaluate how well the MRCBS predicts expression level, we measured the correlation between CAI values of the data set and evaluation set as merit of the method. We iterated the procedure by changing the expression level threshold T and repeating the subsequent steps until we arrived at an optimal merit of the method. Thus, we obtained the optimal threshold value of MRCBS of the whole genome expression data.
In this work, the expression level predictors CAI, RCA, and MRCBS have been computed by comparing its codon usage bias with the profile of universally functional genes, such as the RP genes, which are commonly referred as a reference set. The PHE are then characterized on the basis of the strength of the codon usage bias derived from the algorithms as described above and a gene is identified as PHE gene provided its MRCBS exceeds threshold value. To this end, we computed Pearson r correlation coefficients between different codon usage bias indices.
Results and Discussion
We analyzed PHE genes in crenarchaeal genomes with respect to MRCBS. We calculated the expression pattern and codon usage in Aeropyrumpernix K1, Hyperthermus butylicus DSM 5456, Pyrobaculum aerophilum IM2, Sulfolobus solfataricus P2, and Sulfolobus tokodaii 7. Threshold scores used to classify highly expressed genes in our approach in Aeropyrumpernix K1, Hyperthermus butylicus DSM 5456, Pyrobaculum aerophilum IM2, Sulfolobus solfataricus P2, and Sulfolobus tokodaii 7 were turned out to be 0.75, 0.68, 0.76, 0.80, and 0.83, respectively. GC content of Aeropyrumpernix K1, Hyperthermus butylicus DSM 5456, Pyrobaculum aerophilum IM2, Sulfolobus solfataricus P2, and Sulfolobus tokodaii 7 are 56.31%, 53.74%, 51.36%, 35.79%, and 32.79%, respectively. This variation of GC content may be regarded as the main reason of codon usage variances between different species of Crenarchaeota. Table 1 displays the statistics of PHE genes, GC content and the maximum value of MRCBS for each of the crenarchaeal genomes used in the study. It was observed that percentage of PHE genes in Escherichia coli was 9% to 10% [9,15] and percentage of PHE genes in Synechocystis was about 10% [11], whereas the percentage of PHE genes in crenarchaeal genomes varied from 11.53% to 33.38% and were independent of GC content or optimal growth temperature of these unicellular organisms. It indicates that the percentage of PHE genes in Crenarchaeota is higher than in bacteria. The correlation between growth temperature and genomic GC content has not established by most of the studies [33,34] and in general, the variation in GC content is mostly elucidated by subtle but persistent mutation biases [35,36].
It is familiar that highly expressed genes show stronger codon usage bias than the genes expressed at lower levels. In agreement with previous other reports [9,10,11], we observed that PHE genes of crenarchaeal species included RP genes, translational/transcription genes, chaperon or degradation genes and many stress and energy metabolism genes. However, all RP genes of crenarchaeal genomes do not incorporate the PHE gene class. The percentage of RP genes in crenarchaeal genomes varies from 47% to 87.88% whereas almost all RP genes in E. coli and yeast fall in PHE class of genes [19,20]. It is remarkable that 99.21% RP genes in yeast genome were PHE [20]. However, an average of 65.56% RP genes in crenarchaeal genomes were found to be PHE, indicating that many RP genes of crenarchaeal genomes were of reduced predicted expression level in contrast to E. coli and yeast. Crenarchaeota generally live in extreme environmental conditions that are likely to affect the expression level of the respective gene responsible for its habitat, energy sources and lifestyle. The highest predicted expression levels of top 10 genes for five crenarchaeal genomes are shown in Table 2. It is worth noticing that these genes are separated into different functional categories. Annotation of these PHE genes was done by Secondary (JCVI) Annotation (http://cmr.jcvi.org/tigr-scripts/CMR/GenomePage.cgi).
As it can be seen from the Table 2, the PHE genes are variably represented among crenarchaeal genomes. We observed that genes belonging to the class of translation, ribosomal structure and biogenesis were generally highly expressed. In the top 10 highly expressed genes among five crenarchaeal genomes, 28 RP genes (56%) were found to be highly expressed (shown in Table 2). The RNA polymerase subunits RpoA1, RpoA2, RpoB, RpoE1, RpoE2, RpoH, RpoK, RpoL, and RPoN as with bacterial genomes were found to be predominantly PHE in many crenarchaeal genomes. Several noticeable genes, e.g., Ths, PCNA, P0, Cdc48, and Pfd which are absent from bacterial genomes, but exist in eukaryotes, were found to be highly expressed in many crenarchaeal genomes. A number of genes which include ribonucleotide reductase, the DNA polymerase sliding clamp and members of the FAD synthetase family, exhibit cell cycle-dependent expression in crenarchaeal genomes. It should be noticed that these genes are usually existed by multiple copies in the genome. Among other PHE genes, Rieske iron-sulfur protein and ferredoxin have important functions in these organisms. Besides, we identified a number of PHE genes which play important role in signal transduction mechanism, amino acid transport and metabolism, secondary metabolites biosynthesis and catabolism, cell wall/membrane/envelop biogenesis, inorganic ion transport and metabolism, coenzyme transport and metabolism, carbohydrate transport and metabolism, intercellular trafficking, and energy production and conversion.
However, a portion of genes categorized as hypothetical genes may be obtained among the PHE genes in most crenarchaeal genomes. Table 2 displays the general statistics of hypothetical or poorly characterized PHE genes found in several crenarchaeal genomes. Goodacre et al. [37] showed that 238 out of 355 essential proteins in 16 model bacterial species comprised proteins in domains of unknown function (DUFs), and most of them characterized single-domain proteins which clearly established the biological importance of DUFs. It suggests that experimental research should emphasis on conserved and essential DUFs for functional analysis. So, PHE hypothetical genes may be interesting candidates for experimental categorizations to find additional key features of the crenarchaeal cell cycle. The temporal and spatial grouping of these genes for chromosome replication, genome segregation, and cell division processes are little categorized in Crenarchaeota than in bacteria and eukaryotes. A comprehensive study of these putative/hypothetical PHE genes should produce a more comprehensive image of the replication and division machineries, and regulatory features of the cell cycle.
Impact Codons
Most amino acids can be specified by more than one codon. Nevertheless, in highly expressed genes, only a subset of potential codons is used (Table 3). There were no impact codons coding His in the presently studied crenarchaeal genomes. The impact codons in crenarchaeal genomes was found to be mostly used in coding Phe, Leu, Tyr, Glu, Ser, Ala, Trp, Pro, Arg, and Gly. Besides His, no impact codons coding Asp and Cys were found in crenarchaeal genomes. The data set investigated here revealed a strong bias of the usage of favored codons in highly expressed genes but lowly expressed gene displayed small amount of synonymous codon usage bias. It is hypothesized that codon translated using an abundant tRNA expedite translation efficiency and this translation selection gives birth of codon usage bias. Frequencies of different codons were noticed to differ between genes in the same genome and between genomes. Using 61 codons and three non-sense codons, almost all organisms have prepared the same codon assignments for each amino acid, but the favored use of individual codons differs to a great extent among genes. The overall nucleotide composition of the genome governed by codon usage pattern is hypothesized to commence selective forces acting on highly expressed genes to expedite translation efficiency. There were no impact codons coding Met, Val, Gln, and Asn in Hyperthermus butylicus DSM 5456 and Pyrobaculum aerophilum IM2.
It was observed that the set of preferred (impact) codons in crenarchaeal genomes coding for Leu, Tyr, Lys, Glu, Arg, and Trp were ctt and ctc, tat and tac, aag, gag, aga and agg, and tgg, respectively. For mesophiles, atg and tcg were the preferential codons coding for Met and Ser while aag is the preferential codon coding for Lys in (hyper)thermophiles. It is important to notice that the distinguished preferred (impact) codons coding Arg and Ile separate mesophiles (cgc and atc) from (hyper)thermophiles (aga/agg and ata). There were no impact codons coding for Asp and Cys in crenarchaeal genomes. We observed that all favored (impact) codons were not GC rich in crenarchaeal genomes. So, GC3 could not accurately measure the bias in codon usage. It is generally acknowledged that bias in synonymous codon usage is influenced by the cellular amount of isoacceptor tRNA genes. In this study, we have noticed that all tRNA genes corresponding to impact codons have not been identified by tRNAscanSE and many tRNAs decode two or more codons, which indicates that impact codons may possibly influence translational efficiency. As the optimal set of favored codons is used in highly expressed genes, this observation could have significant role in improvement of tRNA finding algorithm.
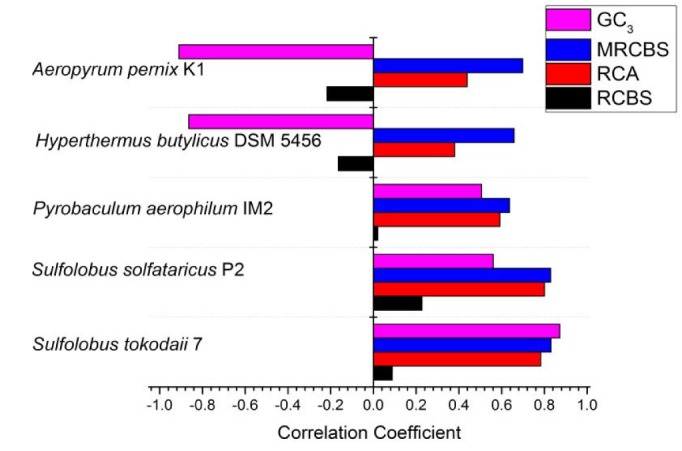
Correlations among different codon bias indices
In this study, we compared the performances of several commonly used measures underlying gene expression. The outlines of gene expression of the crenarchaeal genomes were governed by calculating CAI, RCA, RCBS, and MRCBS. Currently, CAI has become widely accepted method for theoretically recognizing highly expressed genes from codon usage in various organisms. The CAI scores were calculated by taking all RP (>80aa) genes as PHE genes which are commonly referred as reference set. RCA frequencies were computed using the identical reference set as used in the calculation of CAI. The results (Fig. 1) indicate that there is a strong correlation between RCA and CAI while the correlation of RCBS with CAI is significantly smaller. The novel method of quantitatively calculating gene expressivity by MRCBS was then compared with CAI and correlation between them was found to be surprisingly good. These correlation coefficients can be used to express the strength of the existing prediction methods. It can be seen that MRCBS consistently yields better correlation than other. We also observed a clear correlation between CAI and GC3, but surprisingly, there was strong negative correlation between GC3 and CAI in some species which cannot be explained.
In order to validate our results with the experimental data [38], we collected proteomics and microarray data and compared the proteomic and microarray results with our predicted values of expression level. Fig. 2 plotted the relative abundances of mRNA and protein levels of the genes of S. solfataricus grown on yeast extract and tryptone (YT) compared to glucose (G) against CAI, RCBS, RCA, and MRCBS. The correlation coefficient between transcriptomics and MRCBS was found to be −0.31 whereas that with CAI, RCA, and RCBS were 0.04, −0.17, and −0.26, respectively and correlation coefficient between proteomics and MRCBS was −0.44 whereas that with CAI, RCA, and RCBS were −0.18, −0.34, and 0.05, respectively. Even though these results are not good, but the results recommend that a quantitative estimate of expression level by MRCBS accomplishes better performance than other existing computational methods.
We demonstrated that MRCBS could be a useful tool for predicting highly expressed genes. The basic concept validating our method was to compare the result of different gene expression measures with a universal measure, the CAI values of the genes. This methodology is accepted as CAI is widely assumed to be universal method and highly correlated with different measures of codon bias used in the literature [13]. Predicting gene expression levels in different crenarchaeal genomes using MRCBS is to make this index a better choice of measuring codon bias than others. CAI hypothesized that background nucleotide composition was uniform and this hypothesis was not always true. RCA uses codon bias of highly expressed genes of a given reference set like other reference set based measures (e.g., CAI) but the difference between RCA and CAI is that RCA uses the patterns of mutational bias observed in the given reference set. For any given reference set, MRCBS first computes the codon bias as the deviation of the observed codon frequency from the expected codon frequency based on its positional base frequencies and ratio between the RCB of that codon and the largest RCB among its synonymous codons is defined as the relative adaptiveness of that codon. Thus, MRCBS takes explicitly into account the mutational bias in the calculation of codon bias and will be more powerful and precise estimator of gene expression.
To measure the predictive performance of MRCBS, we compared the performances of several commonly used measures in different crenarchaeal genomes. Our results demonstrated that MRCBS well correlated with CAI than other codon bias measures in all crenarchaeal genomes. Since experimental methods are expensive and laborious, results of gene expression by computational methods might be used as reference data for validating and better understanding experimental data. For example, findings of PHE gene with low level expression from proteomic or microarray data could suggest the probable contribution of degradation in regulating expression levels of that gene [8]. Although most of the PHE genes are essential genes responsible for the habitat, energy sources and life style of different species of Crenarchaeota, the results are also predicted a number of genes in DUF as PHE genes. Combined study of computational and experimental approach of these genes will enrich our knowledge of metabolism.