Introduction
For a last decade, mass spectrometry (MS)-based proteomic technologies have emerged as a core technology to measure protein expression and the sites with post-translational modifications (PTMs) on large scales. However, MS-based proteome analysis has been possible for only a limited number of proteins and also limited in accurately detecting low abundant proteins and the peptides with low abundant PTMs [1,2,3,4]. Recent advances in high-resolution peptide separation, comprehensive fractionation, and high performance MS considerably improved the proteome size and depth (increased numbers of proteins and PTM sites measured) and also the accuracy in quantitative information of proteomic data (abundances of proteins and PTM sites) [5]. Moreover, MS-based proteome analysis required large amounts of samples to measure reliably proteins and PTM sites. To resolve this problem, the methods for serial enrichments of different PTMs from the same sample have been developed to significantly reduce the sample amount required [6]. These advanced MS-based proteomic technologies have facilitated the generation of proteome and PTM profiles in tissue and body fluid (plasma/serum, urine, ascites, cerebrospinal fluid, synovial fluid, saliva, and tear) samples collected from the patients with a broad spectrum of human diseases.
Comparative proteomic analysis of samples from the patients and healthy control subjects is commonly applied to identify protein biomarker candidates [7,8,9,10]. In this analysis, proteome profiles are first obtained for tissue or body fluid samples collected from the patients with a target disease and also healthy subjects, and the proteins showing altered abundances, called differentially expressed proteins (DEPs), in disease samples, compared to control samples are then identified (discovery phase) [10]. In the protein biomarker discovery platforms, about hundred DEPs are selected as an initial set of biomarker candidates, and their altered expression are then verified in a small cohort of the patients, which is independent to the patients used in the discovery phase (verification phase) [5]. However, the number of DEPs is often larger than 100, and how to select the initial set of biomarker candidates is not straightforward, although fold-changes and/or associations of the DEPs with pathophysiological processes in the target disease can be used as the criteria for selection of the initial set of biomarker candidates. Next, for the initial candidates whose disease-related alterations in their abundances were confirmed in the small cohort during the verification phase, their validity as biomarkers is tested in a large cohort of the patients (validation phase) [5]. Finally, the biomarker candidates whose altered expression was confirmed in the large cohort are selected as the final set of biomarkers.
Recently, a number of studies have reported that cellular pathways can serve as better indicators of disease states than individual molecules [11,12,13,14,15,16,17]. Pathway enrichment analysis provides a list of cellular pathways enriched by the DEPs, and a set of cellular pathways related to pathophysiological processes can be then selected as altered cellular pathways in the target disease. Next, we can focus on a subset of DEPs that are involved in the selected cellular pathways. Furthermore, network analysis for this subset of DEPs enables effective identification of key molecules that represent the selected cellular pathways as protein biomarker candidates. Using this approach, an initial set of biomarker candidates can be selected more effectively than the conventional criteria, such as fold-changes and associations of the DEPs with the target disease. Thus, several network-based approaches to identify disease-related cellular pathways and representative proteins of such pathways have been developed. In this review, we summarize bioinformatics methods for network-based protein biomarker discovery and also key components in these network-based methods.
Results
Peptide and protein identification
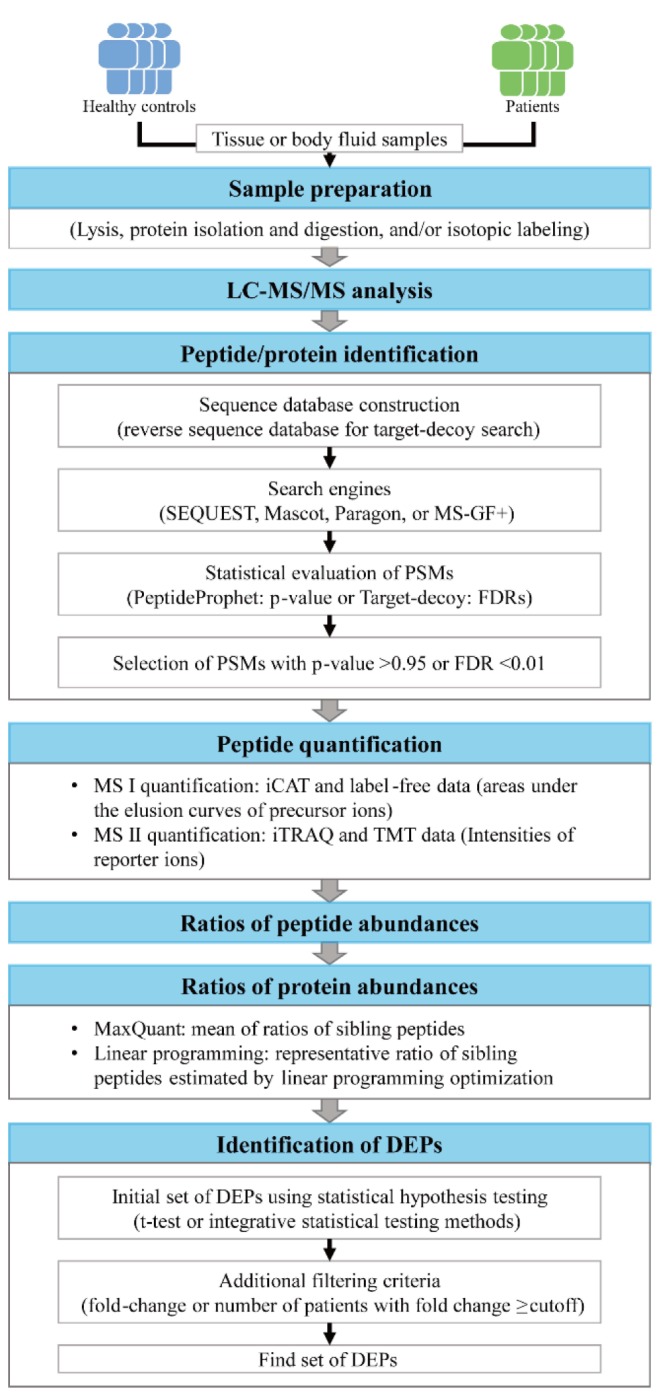
After obtaining proteomic data from tissue or body fluid samples using liquid chromatographyŌĆōtandem mass spectrometry (LC-MS/MS) analysis, the tandem mass spectrometry (MS/MS) spectra are first searched against a protein sequence database (e.g., SWISS-Prot or UniProt) to identify the peptide sequences for individual MS/MS spectra (peptide/protein identification) (Fig. 1). The detected proteome size determines the depth to understand disease-related cellular networks based on the proteome data. Thus, a sufficient size of the detected proteome is a prerequisite in effective discovery of protein biomarkers based on disease-related networks. To ensure an adequate proteome size, accurate identification of the peptides for MS/MS spectra is important through database search using the engine, such as Mascot [18], SEQUEST [19], MS-GF+ [20], or Paragon (Table 1) [21]. During the database search, a score is assigned by the search engine to each peptide that can be generated from the sequence database, which reflects the degree of the agreement of the measured MS/MS spectrum to the theoretical spectrum of the peptide. For example, SEQUEST assigns the scores of X-corr, deltaCorr, SPrank, and SP value to the peptide, whereas MS-GF+ assigns ŌĆōlog10(E-value) to the peptide. For each measured MS/MS spectrum, the peptide with the largest score value is then selected, which defines a peptide-spectrum match (PSM).
Next, the statistical significance of the PSMs resulted from the database search is evaluated using a statistical method, such as PeptideProphet [22] in the Trans-Proteomic Pipeline [23] or the target-decoy method (Table 1) [24]. For example, for each PSM, PeptideProphet combines the scores (X-corr, deltaCorr, SPrank, and SP value) to an F score, and a mixture of Gaussian and Gamma distributions is fitted to the distribution of F scores for all PSMs. Using the mixture distribution, the probability of a PSM being true (PeptideProphet p-value) is estimated [25]. Finally, the PSMs with PeptideProphet p-value > 0.95 are selected as the correct PSMs. In the target-decoy method, a reverse sequence database was generated by inversing the reference protein sequence in the database and then included in the database prior to the database search. Using the score values for the PSMs in which the peptide sequence was obtained from the reverse sequence database, false discovery rates (FDRs) for all PSMs are estimated [24]. Finally, the PSMs with FDR < 0.01 are selected as the correct PSMs.
Recent studies have shown that the best coverage of the detected proteome can be obtained by combining the outputs from multiple search engines. For example, Compid enables the integration of Paragon and Mascot (Table 1) [24] by assigning the peptides with higher scores from the two search engines to the MS/MS spectra, which can leads to unreliable false positive rates. Also, MSblender integrates the search scores from the search engines into a probability score for every possible PSM and then estimates FDRs for the PSMs in a reliable manner [26]. This method identifies more PSMs than any single search engine at the same FDR. After identifying all the PSMs from the database search, a list of the detected proteins are further identified. Using the SEQUEST search outputs, the probability that a protein is correctly identified (ProteinProphet p-value) is calculated by statistically combining the PeptideProphet p-values of the peptides derived from the protein, and the proteins with PeptideProphet p-value > 0.99 are selected as the proteins correctly identified [22]. In the target decoy method, the proteins with more than two non-redundant peptides with FDR < 0.01 can be considered as the reliable proteins [27].
Protein quantitation
Several LC-MS/MS approaches provide quantitative information of the peptides identified from the database search (protein quantification) (Fig. 1). First, prior to LC-MS/MS analysis, the peptides can be labeled using the isotopic agents, such as isotope-coded affinity tag (iCAT) [28], isobaric tag for relative and absolute quantitation (iTRAQ) [29], or tandem mass tags (TMT) [30]. For the iCAT data, the abundance of an identified peptide is estimated as the area under the elusion curve of the peptide. On the other hand, for the iTRAQ or TMT data, the peptide abundance is estimated as the intensities of the reporter ions in the MS/MS data [31]. Second, when no isotope labeling was done, called label-free LC-MS/MS analysis, the peptide abundance is estimated as the area under the elusion curve of the peptide as done for the iCAT data. Next, the relative abundance of an identified peptide is calculated as the ratio of the peptide abundances between patient and control samples. From the iCAT data, the ratios of the heavy and light peptides are calculated as the relative peptide abundance. To estimate the relative abundances of a protein, a list of the peptides derived from the proteins are identified and the relative abundances of these peptides are then combined using a method for protein quantitation, such as the quantification tool in MaxQuant software [32] or a linear programming method [33].
Identification of differentially expressed proteins
The biomarkers should reflect the alteration of disease-related pathophysiological processes in the patient samples, compared to controls. Thus, the DEPs between control and patient samples are identified as the biomarker candidates (identification of DEPs) (Fig. 1). A number of statistical methods have been developed for identification of the DEPs, such as t-test [34] or integrative statistical methods [35,36], with the multiple comparison correction. These methods compare the relative protein abundances between control and patient samples and then estimate the significance (p-value or FDR) of the difference in the relative protein abundances between control and patient samples methods. The proteins with p-value or FDR < 0.01 or 0.05 are then selected as the DEPs. Furthermore, additional constraints are used to select more reliable DEPs. For example, for each DEP, the number of the patients showing the fold-changes larger than a cutoff (1.5- or 2-fold) is counted, and a subset of DEPs with the number of patients larger than a certain percentage (50% of the patients) can be selected as the reliable DEPs [37]. Using this criterion, we can focus on the DEPs that are likely to show their alterations in the abundance in at least more than half of the patients when they were used as biomarker candidates for newly collected patient samples.
Functional enrichment analysis
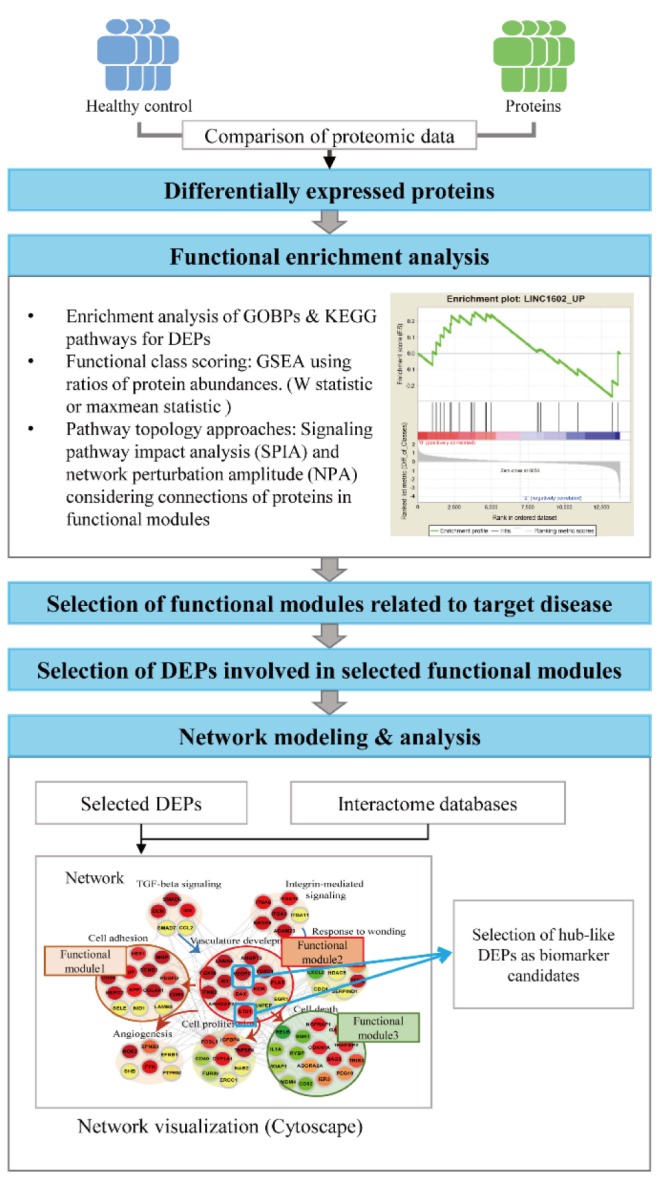
The alterations in protein abundances under disease conditions reflect simple clinical symptoms that are commonly observed in many other diseases, such as inflammation or immune responses, or the alterations of the pathophysiological processes specific to the target disease, such as aggregation of toxic proteins in neurodegenerative diseases. Thus, the DEPs that are involved in the disease-related pathophysiological processes can represent more effectively the alterations specific to the target disease (Fig. 2). To effectively understand the pathophysiological processes altered under disease conditions, functional enrichment analysis is often performed for the DEPs using diverse enrichment tools. For example, the enrichment analysis of gene ontology biological processes (GOBPs) or Kyoto Encyclopedia of Genes and Genomes (KEGG) pathways can be applied to the DEPs using DAVID [38] and PANTHER [39], and commercial tools, such as MetaCore [40] and Ingenuity Pathway Analysis (IPA, QIAGEN Redwood City, http://www.qiagen.com/ingenuity) (Table 1). A list of GOBPs or KEGG pathways with enrichment p-value < 0.05 are selected as the pathophysiological processes or cellular pathways altered under disease conditions. Of these selected GOBPs and KEGG pathways, a subset of the GOBPs related to the target disease is further selected based on the knowledge of the target disease. Finally, a subset of the DEPs that are involved in the selected GOBPs or KEGG pathways related to the target disease can be selected as an initial set of biomarker candidates, considering that these DEPs are likely to be specifically associated with the target disease.
No enrichment analysis mentioned above consider quantitatively the differences in fold-changes of the DEPs, but consider equivalently the DEPs that were selected using a fixed cutoff (p-value and/or fold-changes). To remedy this problem, several functional class scoring methods have been developed, such as gene set enrichment analysis (GSEA) (Table 1, Fig. 2) [41]. In the GSEA, all D-changes, and the enrichment of functional modules defined in the database, such as the molecular signatures database (MSigDB) (Table 1), by the top or bottom of the ranked protein list is statistically evaluated. Several alternative module-level statistics to the conventional GSEA have been also used, including Kolmogorov-Smirnov statistic and the maxmean statistic [42]. Moreover, as an alternative enrichment analysis, several pathway topology approaches have been developed, such as signaling pathway impact analysis (SPIA) [43] and network perturbation amplitude (NPA) (Table 1, Fig. 2) [26]. These approaches consider whether the proteins involved in functional modules defined by GOBP or GSEA database (MSigDB) interact with each other in cellular networks. In the SPIA, a conventional overrepresentation measure, as in GOBP enrichment analysis and a topology measure of the pathway are combined to identify functional modules in which the DEPs are significantly connected. In the NPA, the upper and lower tiers are defined as cellular pathways (e.g., mitogen-activated protein kinase pathway activation) and target genes/proteins regulated by the pathways in the upper tier, respectively, and positive and negative causal relationships are defined by the links between the upper and lower tiers. Then, NPA evaluates the causal relationships by quantitatively summarizing whether the expression changes of the downstream nodes are consistent with pathway activation, inactivation, or no change. These analyses provide a list of functional modules significantly altered under disease conditions. Similar to the case of the GOBP enrichment analysis, a subset of function modules related to the target disease can be identified, and a subset of DEPs involved in the identified functional modules can be selected as an initial set of biomarker candidates.
Network modeling and analysis
Functional molecules or cellular networks altered under disease conditions interact closely with each other to form a disease-perturbed cellular network. The network model enables identification of hub-like molecules that can serve as core indicators of the activities of cellular processes described in the network model. Thus, it is important to understand the disease-perturbed cellular network to identify the core indicators as the biomarker candidates. The core molecules and their associated cellular pathways have been further suggested as therapeutic targets or the biomarker candidates that can be used to evaluate the efficacy of the treatments (e.g., drug efficacy) for the target disease. Hence, the network-based approaches have been employed for protein biomarker discovery.
The network-based approaches first reconstruct a disease-perturbed cellular network model describing the interactions of the DEPs or a subset of the DEPs involved in the selected GOBPs related to the target disease using protein-protein (PPIs), protein-DNA (PDIs), and/or protein-metabolite interactions (PMIs) in the following interactome databases (Table 1, Fig. 2): (1) PPI databases: human protein reference database (HPRD) [44], biological general repository for interaction datasets (BioGRID) [45], biomolecular interaction network database (BIND) [46], search tool for recurring instances of neighbouring genes (STRING) [47], and Molecular INTeraction database (MINT) [48]; (2) PDI databases: EdgeExpressDB (FANTOM4-EEDB) [49], transcriptional regulatory element database (TRED) [50], MSigDB [41], MultiNet [51], and MetaCore [40]; and (3) PMI database: KEGG pathway database [52].
Next, the network model are analyzed to identify network modules or clusters each of which includes a set of the nodes densely connected in the network (Fig. 2). For network clustering or modularization, a number of methods, such as jActiveModules [53], ResponseNet [54], NetWalker [55], and clusterMaker [56], have been developed (Table 1). These methods can be categorized into two groups. One group, such as clusterMaker, searches for the node clusters based on the network topology information such that the nodes in the same cluster have dense connections, but sparse connections between the different clusters [56]. The other group, such as jActiveModules, uses the quantitative fold-changes of the nodes between control and patient samples measured by LC-MS/MS together with the network topology information. In this group, the node clusters are identified such that the nodes in the same clusters are densely connected and also show similar alteration patterns in protein abundance [53].
For functional interpretation of the node clusters resulted from network clustering, functional enrichment analyses mentioned above are then performed for the nodes in each network cluster. Of the node clusters, prior to the enrichment analysis, we can focus on the major network clusters including large numbers of the DEPs. The functional enrichment analysis then provide a subset of the major network clusters whose functions (e.g., GOBPs or KEGG pathways) are associated with the disease-related cellular processes. This subset can be considered as potential determinants of the disease-perturbed cellular network. Finally, the hub-like DEP in each major network cluster is selected as a biomarker candidate that can reflect the perturbation of the disease-related cellular process associated with the network cluster. Mitra et al. [57] demonstrated the power of the network-based biomarker discovery approach in prediction of metastatic cancers in human breast cancer. They identified network clusters with dysregulated expression using SigArSearch and showed that the network clusters were more accurate in distinguishing metastatic cancers from non-metastatic cancers, compared with individual cancer-gene markers.
Integrative analysis of proteomic data with other global data
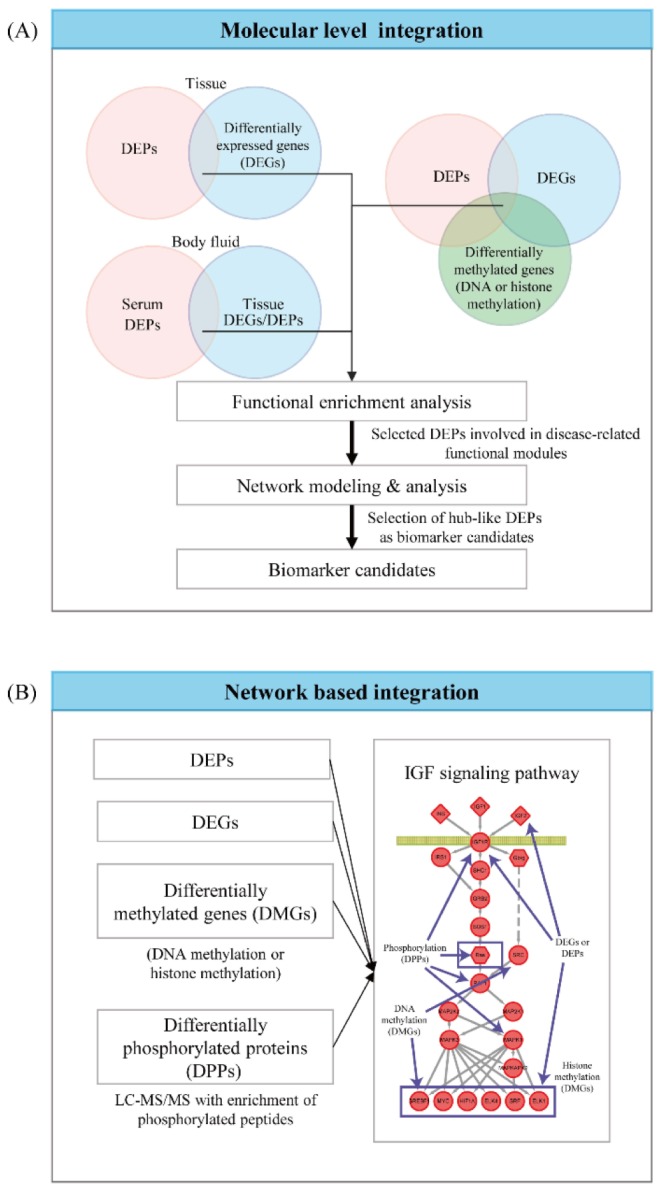
Other global data than proteomic data, such as mRNA expression, mutation, DNA methylation, histone modification, can provide complementary information that enables to select reliable biomarker candidates when they are integrated with the proteomic data. The integrative analysis of proteomic data with other types of global datasets can be categorized into two groups (Fig. 3): (1) the molecular level and (2) the network-level integration methods [58]. The proteome data are contaminated with the noises coming from numerous sources of technical variability during LC-MS/MS experiments and biological variability in patient samples during sample collection and preparation [59,60]. The integration of disparate global datasets reduces the artifacts of the noises in selection of the DEPs by enabling us to focus on the reliable DEPs showing consistent changes between control and patient samples in multiple types of global data [58].
In the molecular level integration method, the DEPs that show consistent alterations in the other global datasets (e.g., mRNA expression data) are searched, assuming that they are more reliable indicators of the perturbation of cellular processes under disease conditions (Fig. 3). Biomarker candidates can be then selected from these reliable DEPs. For example, the DEPs selected from the tissue data can be supported by the consistency in the altered expression of their corresponding mRNAs. Also, the DEPs can be further supported by the consistency in the changes of copy number variations or DNA and/or histone methylations of the corresponding genes. Moreover, the reliability of the DEPs selected from the serum proteome data can be supported by the altered expression of their corresponding mRNAs or proteins in the tissues from the target organ. Hyung et al. [61] demonstrated the value of the integrative analysis of serum proteome data with mRNA expression and proteome data obtained from the tissues in human breast cancers. They selected the DEPs between the serum samples collected from sensitive and resistant patients to a combinatorial chemotherapy using doxorubicin and docetaxol and then further selected the DEPs with altered expression of the corresponding mRNAs and proteins in the breast tissue samples. During the validation of biomarker candidates, they showed that the DEPs with the consistent alteration in the tissues showed higher accuracy in their validation using western blotting for a validation cohort of independent serum samples.
Individual patients can show the variation in altered molecules of a cellular pathway though the same pathway is consistently perturbed under disease conditions. Given the variation, these molecules cannot be selected as DEPs using the conventional statistical methods, thereby leading to the failure to identify biomarkers that reflect the alteration of such cellular pathways. Thus, it has been addressed that cellular pathways can serve as a more reliable indicator of the altered cellular processes under disease conditions, compared to individual molecules [58]. Different types of molecules (mRNA/proteins, microRNAs, DNA methylations, and metabolites) can represent distinct layers of cellular networks. Thus, a cellular network can be modeled in a multi-layered network where each layer can be delineated by a distinct type of the molecules. For example, transcriptional and microRNA regulatory networks are defined by interactions of transcription factors and microRNAs, respectively, with their target mRNAs. Also, cellular signaling networks are defined by protein-protein interactions (kinase-substrate interactions), while DNA methylation networks are defined by interactions of methyltransferases and demethylases with their target DNAs and mRNAs. The integration of multiple global datasets for different types of molecules enables us to decode the multi-layered cellular networks associated with the target disease. A number of the tools have been developed to understand the subnetworks (network clusters) of the multi-layered networks whose perturbations are collectively indicated by different types of global datasets, including IPA (QIAGEN Redwood City, http://www.qiagen.com/ingenuity), HotNet [62], or SteinerNet (Table 1) [63]. Although these tools can be applied for integration of proteomic data with other types of global data, they have been used mainly for integration of disparate genomic and transcriptomic data. Recently, Shi et al. [64] developed NetGestalt that can be used for integration of multi-dimensional global datasets including proteomic data. For example, using NegGestalt, Zhu et al. [65] identified KRAS and AKAP12 subnetworks that can play important roles in pathogenesis of colorectal cancers by integrating proteomic data with mutation, copy number variation, DNA methylation, and mRNA expression data generated from colon tissues and cells. Finally, the hub-like molecules in the subnetworks are selected as key indicators of the alterations of the disease-related processes associated with the subnetworks. For example, Iliopoulos et al. [66] identified a set of the biomarker candidates by performing the network-based integration of the proteome and microRNA expression data. Also, The Cancer Genome Atlas (TCGA) research network identified the notch signaling pathway as a key molecule representing the pathogenesis of ovarian cancers by integrating somatic mutation, copy number variation, and mRNA expression data using HotNet analysis [67].
Discussion
In this review, we summarized a battery of bioinformatics analyses for network-based biomarker discovery using LC-MS/MS data. These analyses include peptide/protein identification using database search engines, peptide/protein quantification from MS or MS/MS data, identification of DEPs using statistical methods, functional enrichment analysis of DEPs using diverse enrichment tools, and network modeling and analysis of DEPs, as well as integrative analysis of disparate global datasets with the LC-MS/MS data.
Peptide identification using database search has been known as a main challenge. Of the MS/MS spectra measured, about half of them are commonly mapped to peptide sequences. The inclusion of PTMs in database search can map the unidentified MS/MS spectra to peptide sequences. However, the PTM inclusion exponentially increases the search time and thus it would be practically impossible to include the most common five PTMs, phosphorylation, glycosylation, ubiquitination, methylation, and acetylation in database search. Recently, although several search tools, such as MODa [68], with improved search speeds have been developed, there is still significant needs for efficient search tools that can include the five common PTMs in the search.
Moreover, protein quantification has been also one of the challenges in MS-based proteomic analysis. Relative protein abundances are estimated by combining the ratios of abundances of the peptides derived from the protein. The same peptide sequences can be derived from multiple proteins due to the redundancy in their sequences, which can cause the discrepancy in the ratios of the peptides from the same protein between control and patient samples. Also, technical and biological variability can add the discrepancy to the peptide ratios. Because of these sources of the discrepancy in the peptide ratios, it has been difficult to estimate the relative ratios of protein abundances between control and patient samples. Recently, although the optimization-based quantification tools, such as linear programming [33], have been developed, there have been significant needs for the quantification methods with improved accuracy.
Due to the issue with protein quantification, identification of DEPs can be also erroneous when inaccurate ratios of protein abundances exist. Additional criteria, such as the number of patients showing fold-changes larger than a cutoff (e.g., 1.5-fold), are used to reduce the error (false-positives) in identification of DEPs. The error in identification of DEPs can further propagate into functional enrichment analysis and network modeling and analysis for the DEPs. Finally, the integrative analysis of disparate global datasets suffers from different scales of fold-changes and the size of detected molecules in the different types of global datasets. For example, mRNA fold-changes between control and patient samples can be relatively larger than the fold-changes of protein abundances, which may cause the bias toward mRNA fold-changes during the integration of fold-changes of mRNA and protein abundances. Also, differentially expressed microRNAs between control and patient samples are smaller than the DEPs or mRNAs, which can lead to the bias toward the DEPs or mRNAs during the integration. Various integration strategies have been proposed to reduce the intrinsic bias from the differences in the size of disparate global datasets. For example, in these methods, mRNA and protein abundance ratios are first integrated and the data with small sizes are separately integrated to the outputs from the initial integration of mRNA and protein data. However, regarding the scale difference in fold-changes, there have been the needs for the algorithms that can effectively normalize the different scales of fold-changes in different datasets.