Introduction
Insulin resistance is a condition in which tissues, such as skeletal muscle, liver, and adipocytes, fail to respond to insulin, leading to type 2 diabetes mellitus. Because skeletal muscle is the primary tissue of insulin-mediated glucose uptake [1], it would be important to study the insulin effects on gene expression in skeletal muscle and to identify the insulin-responsive target genes and regulatory genes.
DNA microarray techniques have been widely used in biological research by enabling comprehensive understanding of molecular and systematic mechanism [2,3]. In addition, microarray experiments enable researchers to identify gene sets undergoing a response to a specific stimulus as well as to analyze dynamic response at the level of gene regulatory network [4]. Especially, microarray experiments could be designed to study downstream effects of a specific stimulus or diverse stimuli on gene expression at the level of genomic scale, not a single genetic one [5]. Microarray techniques could be a power tool to discover regulatory factors as most of co-expressed genes are co-regulated by the same regulatory factors [6]. Moreover, because genes co-regulated by the same transcription factor (TF) commonly share binding sites for this TF [6], it would be worth to detect TF based on motif discovery method.
Although diverse motif discovery methods have been proposed and refined [7,8,9,10], most of them are restricted to using human annotated position weight matrices (PWM). On the other hand, iRegulon, a user-friendly Cytoscape plugin, provides approximately nine thousand PWMs that have been collected from various sources and from different species and enable to make regulatory network by linking them to candidate TF [11]. The other approach for pathway analysis is Genomica [12], which yields regulatory modules from gene expression based on probabilistic graphical models and Bayesian networks. It has a benefit in directly mirroring expression of their target genes in a specific condition by comparing expressions between regulators and their target genes [12]. However, this approach requires looping over all regulators, taking too much time in big data.
Here, we tried to construct a regulatory network in order to understand the regulation of insulin-response genes. We identified about 560 genes differentially expressed between before and after treatment in insulin sensitive individuals, and found that those genes act for insulin signaling biological process through Gene Ontology (GO) analysis. Furthermore, we report a reliable regulatory network cont-rolling insulin-mediated genes by integrating motif-based approach using iRegulon and expression-based approach using Genomica; thereby present some benefits for the construction.
Methods
Study samples
We downloaded and re-analyzed a previous published mRNA expression microarray data set measured on Affymetrix Human Genome U95A Array (Affymetrix, Santa Clara, CA, USA) from the Gene Expression Omnibus (GEO) database (GSE22309) [5]. This data was measured in human skeletal muscle cell of human individuals: 20 insulin sensitive, 20 insulin resistant, and 15 diabetic patients for before and after insulin treatment. We used only the insulin sensitive group. Total of 12,626 probes were monitored, and we considered genes which are protein-coding gene.
Insulin-mediated genes
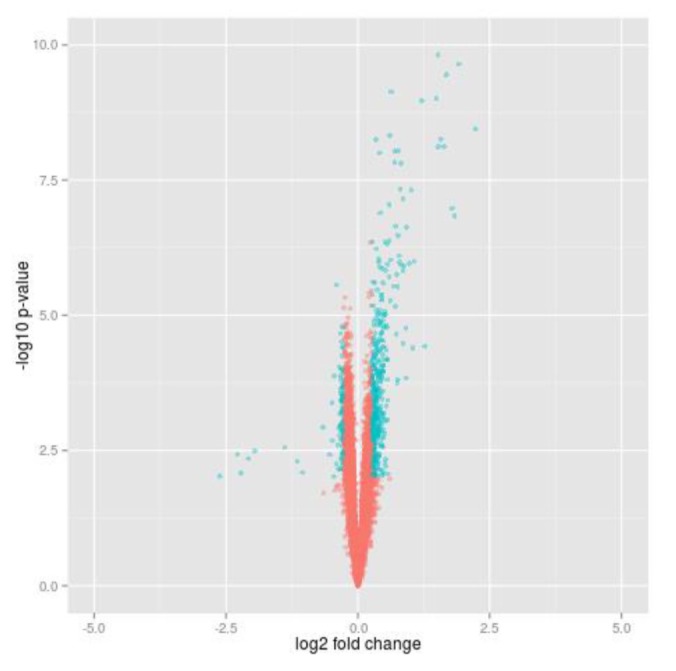
To select differential genes before and after insulin treatment in 20 insulin sensitive individuals, we carried out paired t test and calculated gene expression fold change. Using local commands of R program, we selected insulin-responsive genes which were significantly dysregulated at p-value (paired t test) < 0.01 (corresponding to FDR [13] ≤ 0.05) and fold change > 1.2 (Fig. 1). We looked for enriched GO terms of the insulin responsive genes using DAVID Functional Annotation Tool [14].
Search for candidate TFs based on regulatory motif and chromatin immunoprecipitation-sequencing
The regulatory factors for insulin-responsive genes were searched using the iRegulon app in Cytoscapev3.2.1. iRegulon detects the TFs and their targets by scanning known TF-binding promoter motifs as well as the predicted motifs discovered from the Encyclopedia of DNA Elements (ENCODE) Project chromatin immunoprecipitation-sequencing data. We set 20-kb upstream for the options "Putative regulatory region," "Motif rankings database," and "Track rankings database." Other options were taken as default. We executed iRegulon and looked for TFs for each down and up regulated genes.
Construction of regulatory networks based on expression value
With TFs searched by iRegulon, we tried to construct regulatory network modules which can explain situation of expressions of target genes based on expression level. This construction was carried out using Genomica [12], which is an analysis and visualization tool for genomic data. Among functions of Genomica, we used the "Create a Module Network." It identifies regulatory network modules from gene expression data based on probabilistic graphical models and Bayesian networks. The options "Max number of modules" and "Min experiments per context" were set at 4.
Results
Insulin-targeted gene set
The expression data of 20 insulin sensitive individuals downloaded from GEO (GSE22309) were analyzed to find genes controlled by insulin. In addition, the data contain expression values of transcripts before and after insulin treatment for each sample. Among the total of 12,626 probes, we selected about 9,000 genes which are protein-coding gene. With expression of each gene, we carried out paired t test between before and after insulin treatment and calculated fold change. A total of 560 genes were identified by cutoff using t test p-value (padj < 0.05) and fold change (FC > 1.2) in insulin sensitive group (Fig. 1). Furthermore, we looked for enriched GO terms using DAVID functional annotation tool, and several biological process terms of the GO database were searched (padj < 0.05). As the resulting list of terms is redundant, the lists were prunedmanually (Table 1). Most of the terms were compatible with insulin response and overlapped to GO terms which have been known from previous studies [5].
TF discovery based on motif using iRegulon
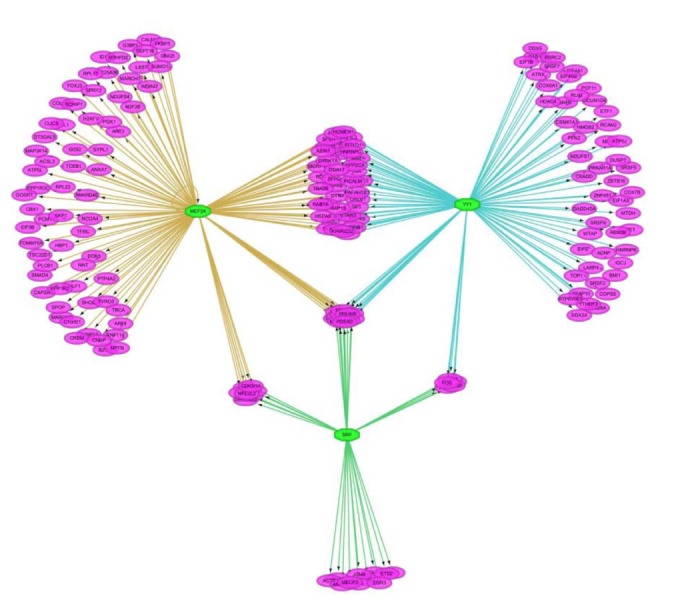
We tried to discover the regulatory TFs for the insulin-treated gene set using iRegulon in Cytoscape. For each down- and up-regulated gene set, we predicted 25 TFs of the target genes based on motif in upstream 20 kb of the target genes. As shown in Fig. 2, target genes are linked to multiple TFs. A single TF targeted about 138 genes in average.
Construction of regulatory network using Genomica
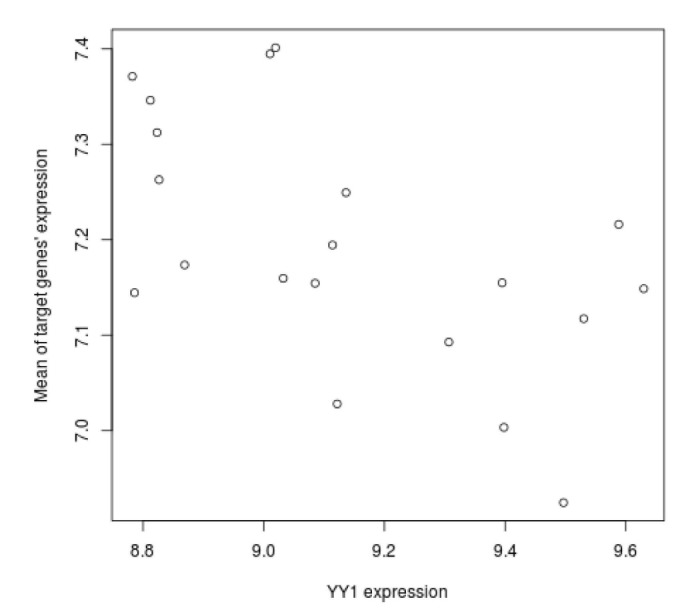
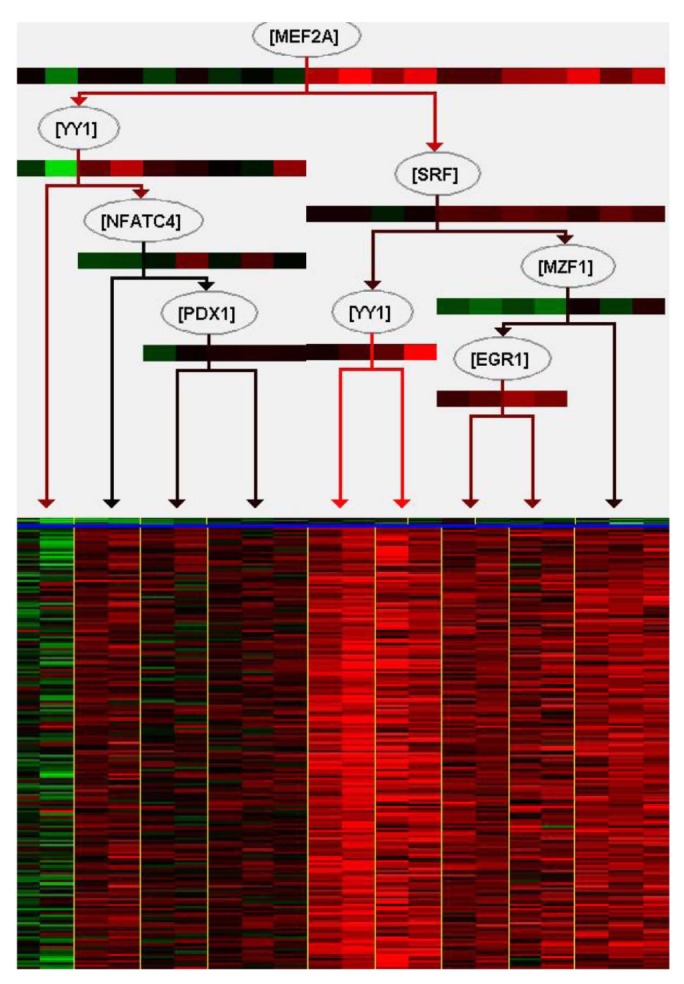
We tried to explain the expression variations of target genes with those of TFs identified by iRegulon. Firstly, we checked correlation between expression of YY1, which is a predicted TF by iRegulon and known for an insulin signaling gene, and mean of those of target genes. However, the correlation coefficient is rather low (Fig. 3). This prompted us to construct the TF network module to explain the expression variations of target genes using Genomica (Fig. 4). We found most TFs participated in regulatory network constructed by Genomica have been known to have relationships with insulin from previous studies [15,16,17,18,19]. While iRegulon provides a list of potential regulatory TFs ignorant of their expression conditions, Genomica has the power to filter the list by constructing conditional hierarchical regulatory network where the expression variations of the target genes are explained by the expression conditions of the filtered TFs. We describe a more reliable regulatory network controlling insulin-responsive genes by integrating completely different methods for constructing regulatory network.
Discussion
Most genes have networks of interactions for appropriate biological functions. Furthermore, regulators do not act alone. Describing a combination of regulatory genes is important to more accurately explain their target genes and understand biological functions. In this regard, construction of regulatory networks can give an insight in the biological interpretation of differential gene set between normal and complex diseases. In order to understand insulin-responsive system, we tried to construct regulatory network with microarray mRNA expression data monitored before and after insulin treatment in skeletal muscle of insulin sensitive samples. For the construction of a reliable network, we carried out integration of two different methods, one based on TF-binding motif and the other on expression variations. Firstly, we defined insulin-mediated gene set using threshold of t test p-value and expression fold change, about 560 genes among total of 12,626 genes were identified. GO enrichment analysis indicated that the gene set is enriched with the biological process terms related with insulin signaling pathway. Especially, among those GO terms, "response to hormone stimulus" and "trans membrane receptor protein tyrosine kinase signaling pathway" have well known links directly to the insulin [8]. To understand regulation of those genes made up of the insulin signaling pathway, 25 TFs were predicted by iRegulon, based on the enrichment of TF-binding motif. iRegulon can infer TFs of target genes, and visualize interactions between TFs and target genes with previously known evidences that what TFs bind to a target gene with sequence information. In this case, expression values of target genes are not considered, and this regulatory network cannot explain how those regulators affect expression variation of target genes. We tried to explain expression variation of target genes with those of TFs identified by iRegulon. However, the expression variation of a TF did not resemble those of target genes. It suggests that expression variations of multiple TFs should be considered collectively to understand those of target genes. With the TFs predicted by iRegulon, we constructed a hierarchical regulatory network among them using Genomica, explaining the expression variation of the target genes. As shown Fig. 4, a combination of multiple TFs instead of a single TF explained the expression variations of target genes. For example, MEF2A which is at the top of the regulatory TF network had the largest influence on the expression variations of the target genes, and YY1, the second highest ranking TF, did not influence as much as MEF2A. However, YY1 affects to increase expression of target genes when MEF2A has low expression value. In fact, MEF2A, YY1, SRF, PDX1, and NFATC4 are known for having relationships with insulin [15,16,17,18,19]. Although expression of downstream TFs in the regulatory network is not perfectly fitted to that of their target genes, the construction based on expression data helps to understand more clearly regulatory network of target genes. Altogether, in this paper, we presented a reliable regulatory network controlling insulin-mediated genes as well as the approach integrating two different methods, iRegulon and Genomica, may allow making a reliable regulatory network.