Introduction
Thanks to the next-generation sequencing (NGS) technology, genomics research area has been developed dramatically in recent years. Since 2008, many efforts have been made to find somatic mutations in cancer genomes; hundreds of samples by exome sequencing have been used to develop diagnosis and prognosis markers in various cancers in recent researches. Cheaper price has enabled us to get more exome sequencing data from hundreds of samples, even thousands of genomes.
By applying exome sequencing to cancer genomes, we can discover somatic mutations and somatic copy-number alterations (SCNAs) on a massive and genome-wide scale. Traditionally, array-based comparative genomic hybridization has been used to discover SCNA, but exome sequencing has many advantages, in that one can derive various results, such as somatic mutations, loss of heterozygosity (LOH), and SCNA. It is still under debate because bioinformatics methods could give different results depending on their parameters and software, but major driver genes of somatic mutations show a similar consensus.
We had used an in-house bioinformatics pipeline and databases for this research, especially "somatic copy-number and heterozygosity alteration estimation" (SCHALE) to find LOH and SCNA. Furthermore, driver genes were also inferred from network and pathway analyses. Protein structure prediction was used to predict putative structural changes by somatic mutations and also possibly their functional changes.
Methods
Dataset
Whole-exome sequencing data of tumor/normal paired samples from 10 individuals with blood cancer were obtained in FASTQ format from PGM21 (The National Project for Personalized Genomic Medicine). For 10 of the samples, the genotype information from single nucleotide poymorphism (SNP) chip was additionally obtained (but not the raw data).
Data processing and quality control (QC)
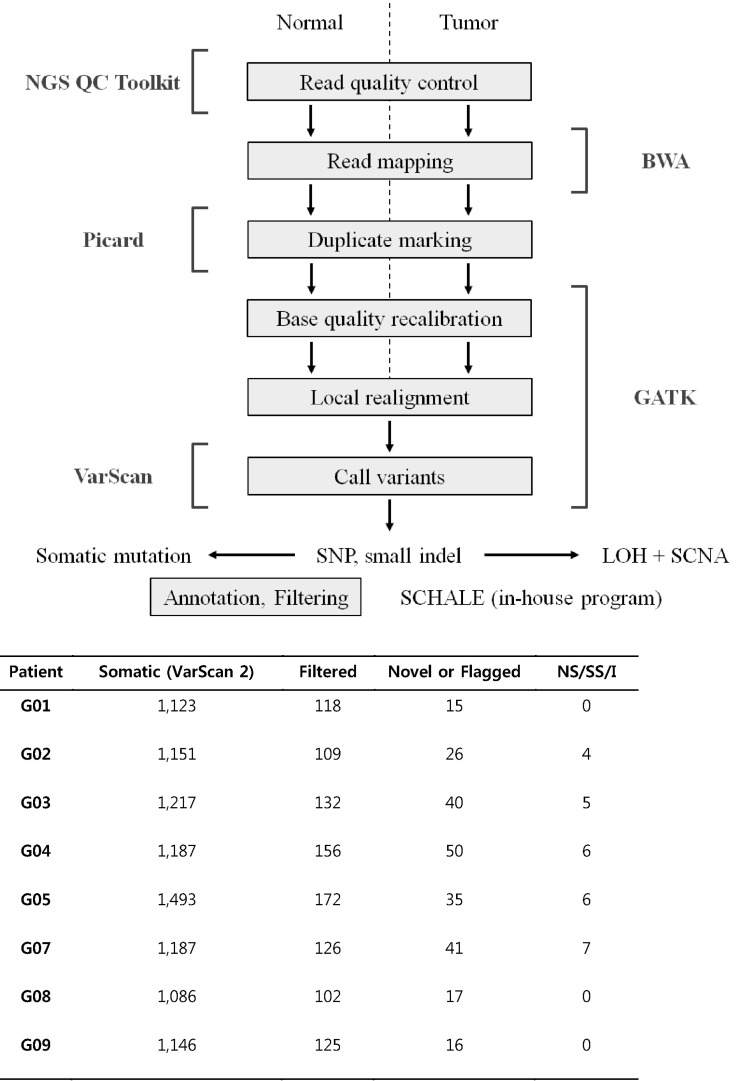
The QC of sequencing reads was performed with NGS QC Toolkit, and the high-quality reads were aligned to the human reference genome (hg19, http://genome.ucsc.edu) using BWA (http://bio-bwa.sourceforge.net/) [1] with default parameteres. Picard (http://picard.sourceforge.net) was used to remove PCR duplicates. Base quality recalibration and local realignment around indels were performed using Genome Analysis Toolkit (GATK, http://www.broadinstitute.org/gatk/). Because our previous study showed that the discordance of indel alignments had potential to generate false-positive somatic mutations, we performed the local realignment after the merging of alignments from same patients. Template lengths were calculated using the processed alignments, and the distributions for each samples were plotted to examine the qualities of sequencing libraries. Variant genotyping for each sample was performed with UnifiedGenotyper of GATK, and the variants were filtered as follows: mapping quality zero (MQ0) ≥ 4 && MQ0/depth of coverage (DP) > 0.1, variation quality (QUAL) < 200, quality by depth (QD) < 5, Fisher strand (FS) > 60, MQ < 40, DP < 10 (5 if no variant allele), genotype quality (GQ) < 13. The genomic annotation of variants was performed with custom-made scripts and refSeq information.
Identification of somatic mutations
We had developed a bioinformatics pipeline for this award program (Fig. 1). VarScan [2] was used to identify somatic mutations. The output of VarScan was filtered as follows: somatic p-value ≤ 0.05, normal allele depth ≤ 1, tumor allele depth ≥ 5, tumor total depth ≥ 10. The mutation set was annotated using a custom-made script with refSeq, SIFT (http://sift.jcvi.org/), MutationAssessor, phyloP46way (vertebrate), dbSNP 137 [3], in-house Korean variation database, etc. We selected the driver mutations that were not in dbSNP 137, excluding clinically associated variants (Flagged track in University of California Santa Cruz [UCSC] Genome Browser) and an in-house Korean variation database, and were deleterious missense, nonsense, read-through, splicesite, or coding indel mutations (NS/SS/I). The deleterious missense mutations were determined if at least 2 out of the following 3 were true: PhyloP score > 1.5, SIFT prediction = deleterious, MutationAssessor Func. Impact = high or medium.
The total numbers of candidates for each filtering step are summarized in Fig. 1. We found somatic mutations in samples G10, G08, and G09, but they were not NS/SS/I.
Comparison with genotypes from SNP chip
To compare with genotypes from SNP chip, the genotyping was performed using UnifiedGenotyper with the intervals, including all the coordinates of SNP chip and the option-output_mode EMIT_ALL_SITES. For each sample with genotype information from SNP chip, overall genotype concordance, non-reference sensitivity, and non-reference discrepancy rate were calculated according to the guide of GATK VariantEval using the genotypes with DP ≥ 5.
Genotype comparison of samples
The multi-sample SNP genotyping was performed with UnifiedGenotyper to compare the genotypes on the variant positions where all samples were able to be genotyped. The filtration scheme was the same as above. The distance between two samples was calculated as the sum of genotype difference values (0 if two genotypes are same, 1 if a genotype is 0/1 and another is 0/0 or 1/1, 2 if a genotype is 0/0 and another is 1/1). The distances were divided by the number of the variant positions. Heatmap and similarity matrix were used to visualize the distances.
Genome annotation
We used in-house genome annotation pipelines and various databaes, as summarized below.
Genomic annotation: refGene
Human Genome Variation Society (HGVS) nomenclature: nucleotide (non-coding, coding), protein
SIFT - tolerant amino acid substitutions
MutationAssessor
phyloP46way_vertebrate
GERP; GERP_element: rsScore
RepeatMasker
Tandem repeat definition
dbSNP 137; Common, Flagged, Mult
Korean variation database (54 Personal Genomes)
OMIM morbid genes
Oncogenes and tumor suppressors from Ariadne Pathway Studio
Detection of LOH and SCNA by SCHALE
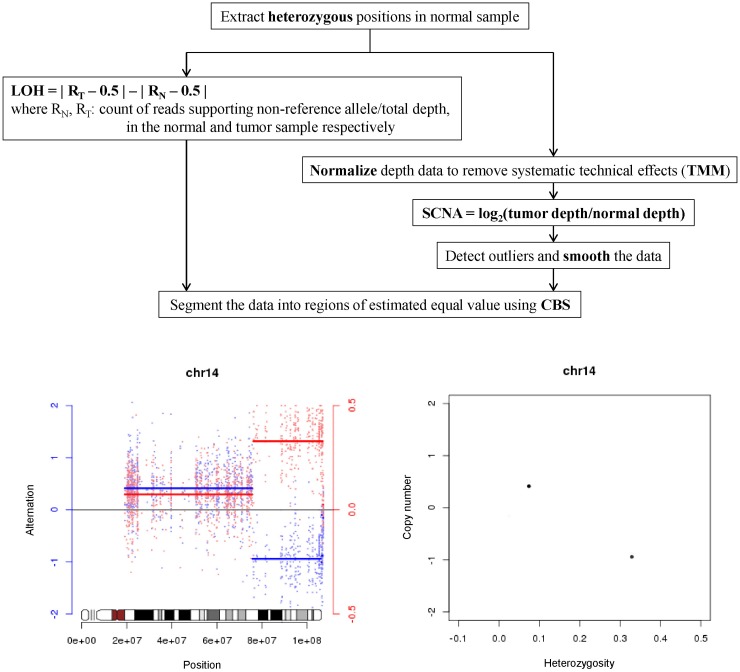
Detection LOH and SCNA was performed with custom-made software SCHALE (Fig. 2). For the positions where the genotypes were heterozygous in normal samples, the values of LOH and SCNA were calculated. The values of LOH were calculated by the equation:
LOH = | RT - 0.5 | - | RN - 0.5 |, where RN is the count of reads supporting a non-reference allele divided by the total depth in the normal sample and RT is in tumor sample. The values of SCNA were calculated by the equation:
SCNA = log2(tumor depth/normal depth), where the depths were normalized using R library tweeDEseq. The values of LOH and SCNA were segmented together using R library DNAcopy with the parameters alpha = 0.01 and undo.SD = 2. The segments and values were plotted for each chromosome with the idiograms in R library SNPchip.
Network analysis
Ingenuity Pathway Analysis (IPA) was used to perform the network study of the identified somatically mutated genes and the genes in the LOH region.
Protein structure modeling
Before the structural modeling, the protein features related to the somatic mutations were found by BLAST on UniProt (10 most similar proteins, expectation value = 1e-30) and residue mapping. Homology modeling was performed using MODELLER (http://salilab.org/modeller) with the templates 1LWD for IDH2, 3KSY for RASGEF1B, and 2O8B for MSH4. Molecular dynamics simulation was performed with GROMACS (http://pubs.acs.org/doi/abs/10.1021/ct700301q). The structural images were drawn using PyMOL (http://www.pymol.org/).
Results
QC and results
We had used several methods to check the qualities of sequence reads. First, we used NGS QC Tools [4] to confirm sequence qualities (Supplementary Table 1). Overall, they had a very good quality, according to NGS QC Tools results. Template length (library size) was also evenly distributed for all samples (Supplementary Fig. 1).
Reference genome mapping
About 98% of reads were mapped onto the human reference genome (UCSC Genome Browser, hg19), summarized in Supplementary Table 2. After a duplicate removal step, 77.85% reads were retained; each sample had up to 25% duplicates. Eighty-nine percent of target areas covered at least 10 sequence reads, which is sufficient for discovering somatic mutations. We did not get target enrichment kit information from PGM21, so we had compared coverage information from several kits and concluded that SureSelect All Exon 50Mb was used for exome sequencing.
Genotyping by GATK and comparison with SNP chip
In order to check the genotyping parameters we had used, 10 SNP chip results were compared. Because SNP chip data were genotypes, we could not infer copy number changes; we could only calculate concordance between exome sequencing and SNP chip. We had used a separate bioinformatics pipeline for checking concordance, and GATK [5] was used mainly for genotyping of germline samples. We had discovered 18,500-19,200 coding SNPs. The number of SNPs from the 5' untranslated region (UTR) was close to that of the 3' UTR, so the target enrichment kit was not the latest 3' UTR extension version (Supplementary Table 3). In general, the 3' UTR is much larger than the 5' UTR; a new 3' UTR extension version of the exome kit will give at least a few times more SNPs than 5' UTR.
Two hundred fifty coding SNPs were retained after removal of dbSNP137 [6] and an in-house Korean database comprised of 54 normal individuals. Among them, we can focus on about 160 variants of NS/SS/I, which is believed to be most functionally important (Supplementary Table 4).
Overall concordance was at least 99.6%. In recent personal genome papers, they reported more than 99.95% concordance between whole-genome and SNP chips. Usually, one can achieve higher concordance if he uses strict parameters for their genotyping. Our purpose is to discover somatic mutations, not genotyping of normal germline, so we did not put much effort to get higher concordance values.
Especially, G10.N SNP chip data were totally different from the exome, because only 77% of SNPs were shared (Supplementary Table 5). As one can see in the table, 77% means they are different individuals (false positive for Award program). Distance and similarity matrix were calculated to see the differences and similarity (Supplementary Table 6, Supplementary Fig. 2). We had concluded that sample G06 has a different sample pair from different individuals. G10 also has only 92% similarity and showed a little similarity between G03 and G04. For such reasons, G10 was possibly contaminated and therefore rejected from our bioinformatics analysis.
In conclusion, we had used only 8 sample pairs for discovery of somatic mutations, LOH, and SCNA.
A list of somatic mutations
After removal of SNPs and indels from dbSNP137 [6] and an in-house Korean database, 27 somatic mutations (NS/SS/I) were discovered from 8 samples. Among them, NPM1 showed a TCTG internal tandem insertion. NPM1-ITD is known to be major driver gene in acute myeloid leukemia (AML) (Table 1, Supplementary Table 7). NPM1-ITD and GATA2 were recurrently found in two samples. We had removed all variants from dbSNP and an in-house Korean database that showed polymorphisms or normal variants, because they can be putatively functionally neutral, even if they are discovered as somatic mutations.
We had downloaded the COSMIC (http://www.sanger.ac.uk/genetics/CGP/cosmic/) database and compared with our somatic mutations. We found the same highly recurrent somatic mutation variants in four genes: NPM1, IDH2, CEBPA, and GATA2.
In 26 genes, we can easily see the NPM1, IDH2, GATA2, CEBPA genes-known to be highly mutated in AML [3]. Based on the recent somatic mutation profiles from exome sequencing, one can see the following trends of them. In solid tumors, somatic mutation in TP53 is high. But in melanoma, BRAF mutation is high. In hepatocellular carcinoma, CTNNB1 mutation is high. It means that somatic mutations can play a different role, depending on cancer. In AML, other than the well-known TP53 mutation, genes, such as FLT3, TET2, and NPM1, show somatic mutations and are the driver genes [7].
Discovery of LOH and SCAN by SCHALE
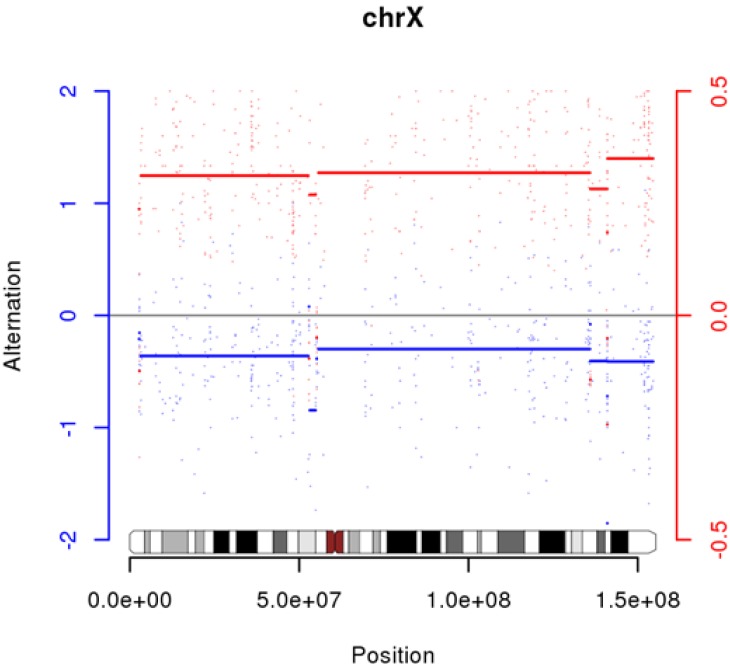
We had used SCHALE to discover LOH and SCNA. It appears that sample G06 has many LOHs and SCNAs, but an incorrect sample pair can give those results (Supplementary Fig. 3). We also discovered high LOH on chrX in G10 (Fig. 3).
We could not find any somatic mutations in G10. Previously, we had described that it could be contamination, but another possibility is that they are exomes from identical twins with different genders (we do not have any gender information from any samples).
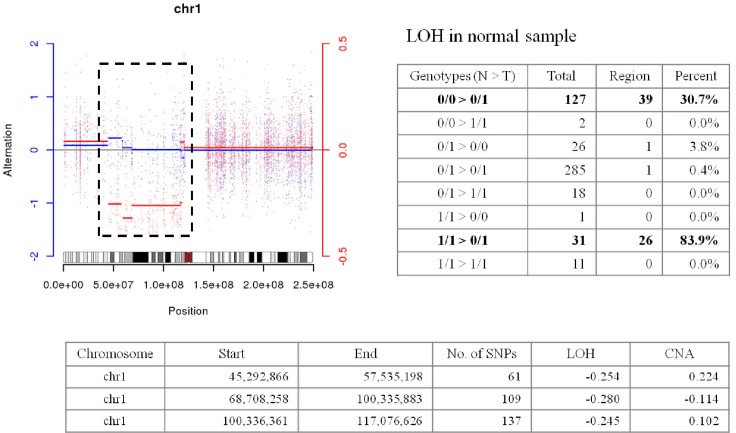
Abnormal regions on chr1 in G05 showed LOH in the germline, but it is quite unnatural (Fig. 4). We are not describing much for this area until experimental validation is performed.
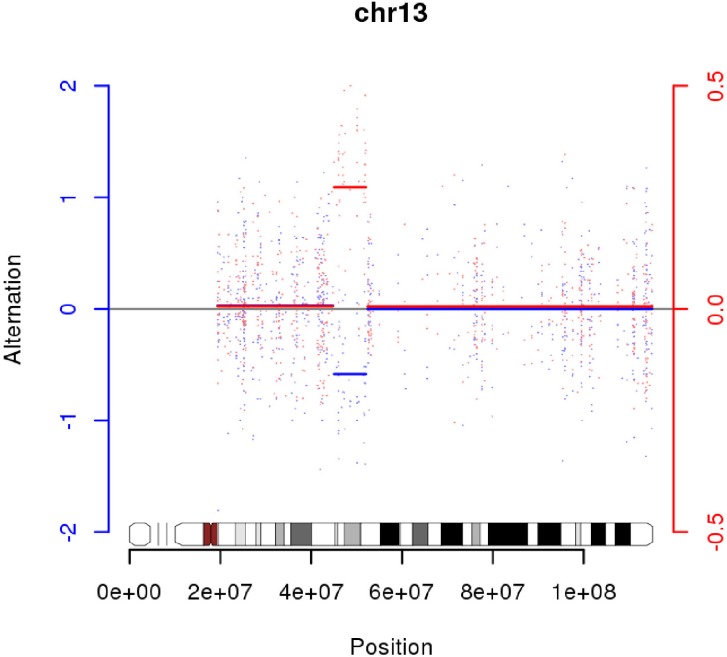
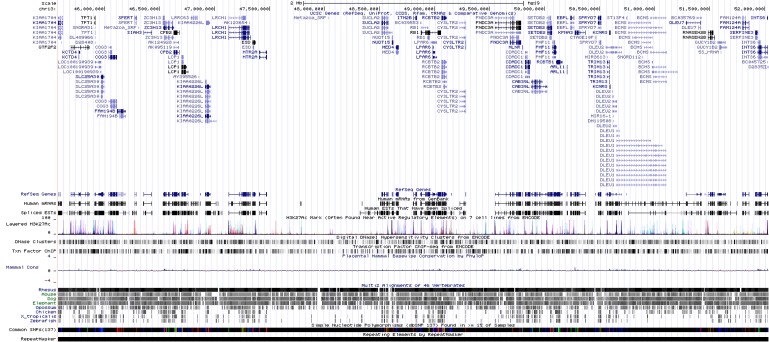
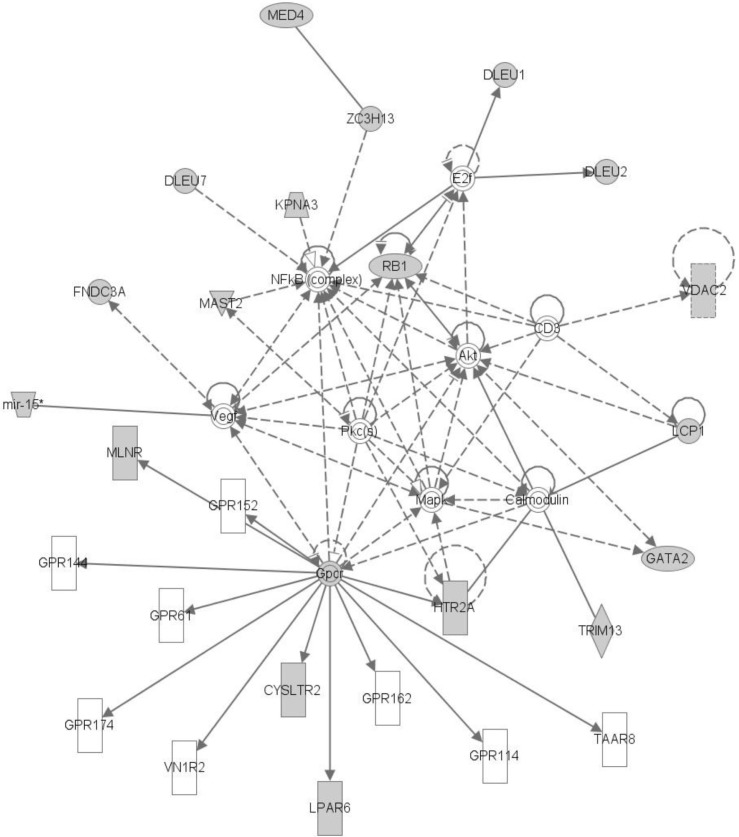
We had found one LOH region on chr13 in G05 (Fig. 5). INTS6 and KIAA1704 are located at both ends and potentially could make a fusion gene (Fig. 6). Experimental validation is also required for this assumption. INTS6 is expressed in blood; many expressed sequence tags (ESTs) were found in INTS6 in UniGene (http://www.ncbi.nlm.nih.gov/UniGene). But, KIAA1704 has a small number of ESTs, so we could not infer expression levels from UniGene. There are 61 genes on chr13:45,578,409-52,035,344, and we had an additional set of network and pathway analyses, including 6 genes (MAST2, L1TD1, MSH4, GATA2, VDAC2, and PHF6) with somatic mutations.
The top network is "Cancer, Hematological Disease, Immunological Disease," comprised of GATA2 and MAST2. Many genes in LOH regions are included in this network. We can infer that those genes with somatic mutations and LOH can interact with each other (Fig. 7).
Network and pathway analyses
Using 26 genes, we had used IPA (http://www.ingenuity.com/) [8] for network and pathway analyses. It can be summarized in two major networks (Table 2).
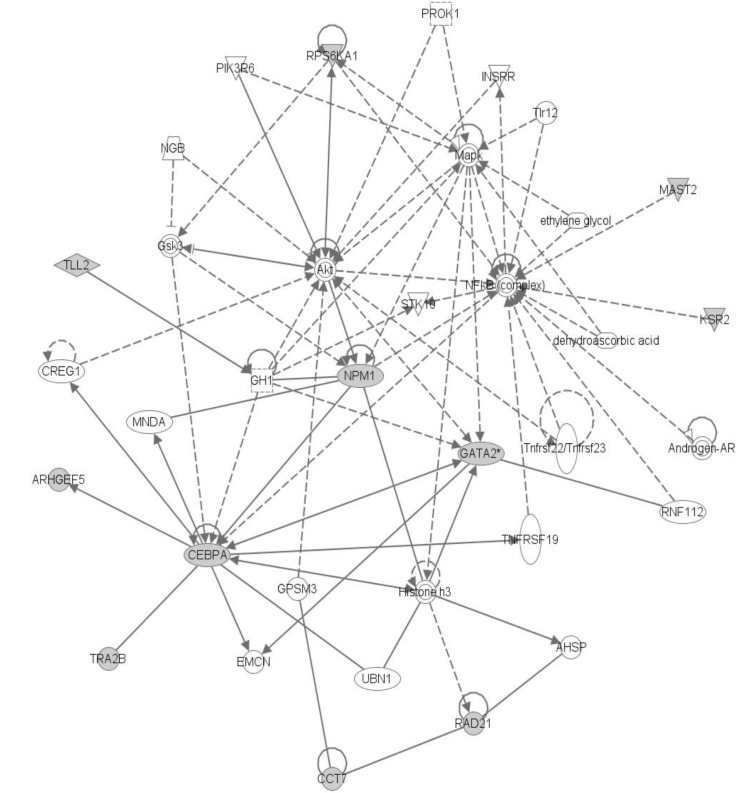
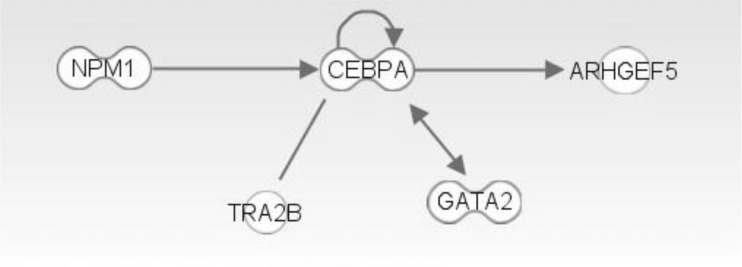
The top network is "Cancer, Hematologicial Disease, Cell Cycle," and it has NPM1, GATA2, and CEBPA genes (Figs. 8 and 9). These three genes showed a highly connected network and well-known major driver genes in leukemia.
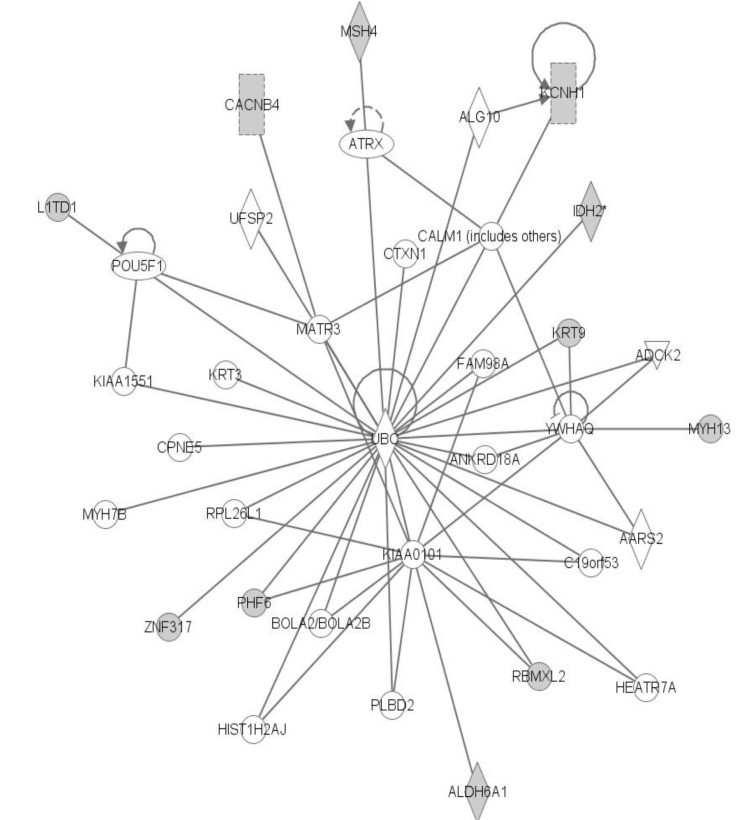
The second network is related to cell death and survival (Fig. 10). IDH2 and PHF6 genes were located in this network. But overall, somatic mutation frequency in the top network is much higher than the second network above.
IPA analysis reports are summarized in Supplementary Table 8.
Protein structure modeling
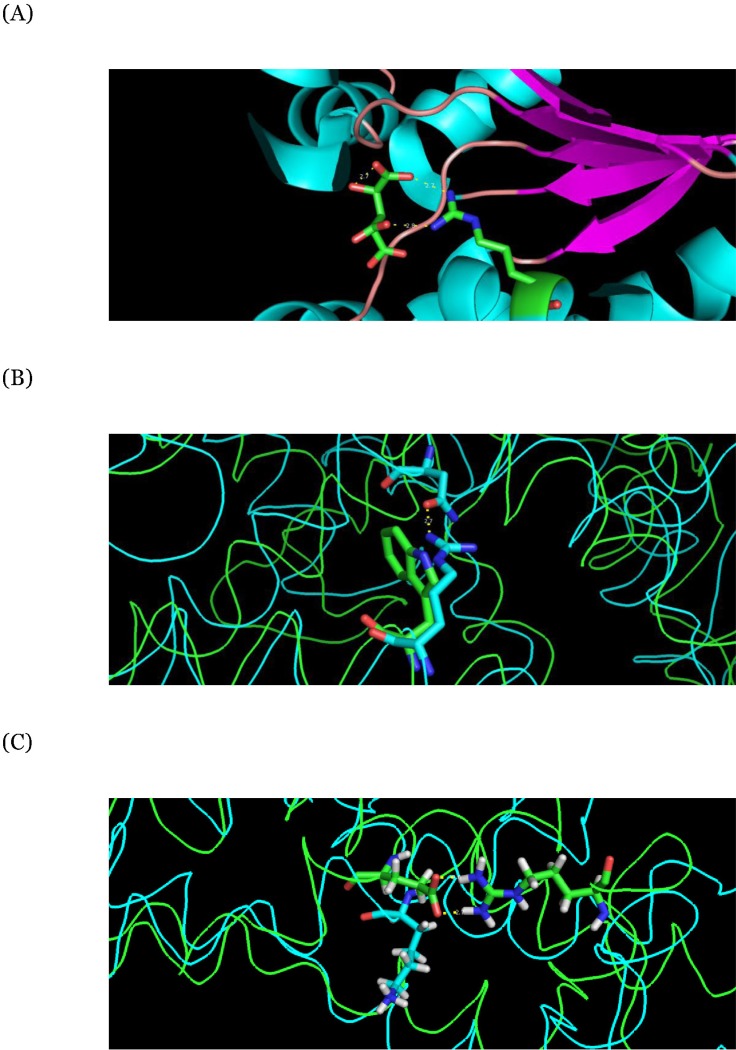
We have examined protein features related to residues substituted by the identified 27 somatic mutations and found the features of 19 mutations (Table 3). The mutation of CEBPA generates a duplication of an amino acid that affects the original helical secondary structure. The residue corresponding to the mutation of IDH2 has a function to bind with its substrate, so the substitutions of the residue decrease the binding affinity with the substrate. The protein region frame-shifted by the mutation of NPM1 is related to the function of nuclear localization, important for maintaining the structure. The structural modeling of RASGEF1B shows that the mutated residue Arg261 generates a new hydrogen bond with Asn303, affecting the stretch of neighbor helical structures. The protein structure of MSH4 shows that the salt bridge between Glu415 and Arg474 is essential for the folding and stability of the protein structure but is broken by the mutation (Table 4, Fig. 11).
Discussion
We have analyzed 10 exome sequencing samples and SNP chip data using a variety of bioinformatics methods. According to the concordance results, comparing with SNP chip data, we concluded that the G10.N exome sample is not the correct pair. Comparing SNPs between normal and tumor pairs revealed that the normal-tumor pair of sample G06 was not matched, and the G10 exome showed abnormal LOH in chrX but had no somatic mutation. So, we had removed G06 and G10 for discovering somatic mutations.
After removing G06 and G10, with 8 paired-end samples, we discovered 27 functionally important somatic mutations with significance. They included well-known genes in AML, such as NPM1, IDH2, GATA2, and CEBPA. Especially, NPM1 and GATA2 were found in 2 out of 8 samples.
In sample G05, we found one abnormal region at chr1 and an LOH region at chr13. We could conclude that the LOH region could potentially make a fusion gene by INTS6 and KIAA1704, and we did further network analysis on that. The results of IPA analysis gave "Cell Death and Survival, Cell Cycle" network as the top network, and it includes GATA2 and MAST2 (somatic mutation).
We had done IPA analysis with 26 genes, giving the "Cancer, Hematological Disease, Cell Cycle Network" as the top network, and it includes NPM1, GATA2, and CEBPA, which are well-known driver genes in AML [3]. Since those 3 genes have many edges in the result, we could conclude that those genes are indirect evidence of driver genes.
The second network is related with "Cell Death and Survival," and it includes IDH2 and PHF6 genes, the same as G05's top network. So far, our conclusion is that 8 samples are related with the "Cancer, Hematological Disease, Cell Cycle Network" but sample G05 is related with the "Cell Death and Survival Network."
We had searched previous works of genome-wide somatic mutation discovery and concluded that 8 exome samples might be AML. Somatic mutation profiles of blood cancer are summarized in Table 5 [3, 9, 10]. But, we could not find any somatic mutations in the FLT3 or RAS gene. Chronic lymphocytic leukemia and Blast Crisis chronic myeloid leukemia did not have somatic mutations in NPM1 or CEBPA.
Seven out of 8 samples showed neither LOH nor SCNA, so we could conclude that those patients had a normal karyotype with no translocation or inversion. If possible, additional RNA-Seq experiments or another technique can provide enough evidence of karyotypes of those samples.
In CEBPA, IDH2, and NPM1, we saw somatic mutations located in helix regions. By using protein structure modeling, we found that IDH2, RASGEF1B, and MSH4 could have structural variations, affecting protein functions. Somatic mutations in IDH2 could break hydrogen bonds.