Genomics Inform Search

CLOSE


Genomics Inform > Volume 10(1); 2012 > Article
Yang and Cho: Comparative Evaluation of Intron Prediction Methods and Detection of Plant Genome Annotation Using Intron Length Distributions

Abstract

Intron prediction is an important problem of the constantly updated genome annotation. Using two model plant (rice and Arabidopsis) genomes, we compared two well-known intron prediction tools: the Blast-Like Alignment Tool (BLAT) and Sim4cc. The results showed that each of the tools had its own advantages and disadvantages. BLAT predicted more than 99% introns of whole genomic introns with a small number of false-positive introns. Sim4cc was successful at finding the correct introns with a false-negative rate of 1.02% to 4.85%, and it needed a longer run time than BLAT. Further, we evaluated the intron information of 10 complete plant genomes. As non-coding sequences, intron lengths are not limited by a triplet codon frame; so, intron lengths have three phases: a multiple of three bases (3n), a multiple of three bases plus one (3n + 1), and a multiple of three bases plus two (3n + 2). It was widely accepted that the percentages of the 3n, 3n + 1, and 3n + 2 introns were quite similar in genomes. Our studies showed that 80% (8/10) of species were similar in terms of the number of three phases. The percentages of 3n introns in Ostreococcus lucimarinus was excessive (47.7%), while in Ostreococcus tauri, it was deficient (29.1%). This discrepancy could have been the result of errors in intron prediction. It is suggested that a three-phase evaluation is a fast and effective method of detecting intron annotation problems.

Introduction

With more and more species' genomes completely sequenced, noncoding sequences have become a focus of researchers' attention, especially for the study of introns. In order to facilitate further research, a number of intron databases have been developed (Table 1). The number of plant intron databases is much smaller than that in mammals and only in several model plants (such as Arabidopsis and rice). Using known genome sequences and coding sequences (expressed sequence tags [ESTs] or cDNA), introns can be detected by aligning coding sequences with genome sequences. Many tools were developed to detect introns in eukaryotes (Table 2) [1-16]. These tools used different algorithms and computer languages (such as Java, C++, and Python) to predict introns.
Therefore, the question is: there are many intron databases, algorithms, and detection methods for the study of eukaryotes, but which among them are the most suitable for the detection of plant introns? Among these tools, the Blast-Like Alignment Tool (BLAT) and Sim4cc are the most commonly used tools. BLAT applies in genomewide alignment [11]. Sim4cc is a tool for aligning cDNA and genomic sequences between species at various evolutionary distances [2]. Rice and Arabidopsis, as monocotyledonous and dicotyledonous model plants, are widespread with regard to in-depth research. Their genome sequences have been annotated in detail, including their gene sequences, complementary DNA (cDNA) sequences, coding DNA sequence (CDS) sequences, exon sequences, intron sequences, and intergene sequences. Therefore, it is possible to use this model plant information to test these intron prediction tools.
Genome annotation is a difficult and accurate project-even the best-annotated or most carefully studied genomes are continually re-released; e.g., release 7 of the Rice Genome Annotation Project was available on October 31, 2011 (http://rice.plantbiology.msu.edu/). But, determining the accuracy and detecting the inherent errors of the genome annotation is a problem. Since introns are removed from protein-coding transcripts, intron lengths are not expected to respect coding frames across the genome [17]. Using intron length distributions, Roy and Penny [18] point out a rapid and simple method for detecting a variety of possible systematic biases in gene prediction or even problems with genome assemblies. Roy's method showed that a good genome annotation is accepted as roughly equal proportions of intron lengths of three phases: a multiple of three bases (3n), one more than a multiple of three bases (3n + 1), and two more (3n + 2). Skewed predicted intron length distributions thus suggest systematic errors in intron prediction. But, many plants with sequenced genomes have not been commented on.
In this study, we compared the advantages and disadvantages of BLAT and Sim4cc for model plants' intron predictions, and we attempted to find a better way to predict the intron information of plants. Based on Roy's method, we evaluated the intron information of 10 plant genomes and discuss a skew in genome wide intron length distributions that indicates systematic problems with intron predictions.

Methods

Genome sequences

Ten plant genome sequences and transcript (EST, CDS, or cDNA) sequences were downloaded and indicated in Table 3 [19-27]. Table 3 contains the name of the 10 plant species, source websites, and genome sequence versions used in this study.

Comparative BLAT and Sim4cc analysis

Using cDNA sequences and gene sequences, we searched rice and Arabidopsis introns by two methods-BLAT and Sim4cc- and then compared the results with annotated information.
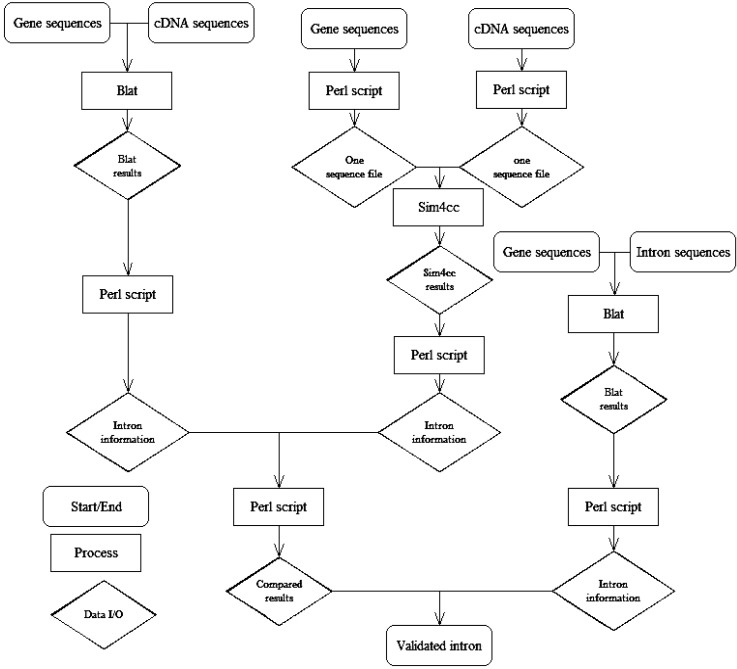
The steps of this method are as follows (Fig. 1): 1) Using the gene sequences of BLAT with its own cDNA sequences, we found intron information from the BLAT results by Perl script. 2) We sliced gene sequences and cDNA sequences to folders by Perl script. In these folders, there was one sequence per file, and the gene name was the file name. Using the same gene name of the gene and cDNA file, we blasted the gene sequences and cDNA sequences using Sim4cc. Then, we got intron information from the Sim4cc results by Perl script. 3) We compared the results of the two types of software (BLAT and Sim4cc) and then got the annotated intron information. 4) We aligned intron sequences with their own gene sequences to develop detailed intron information, such as the intron position in the gene, intron length, intron number, forward-exon length, and backward-exon length, etc. 5) We compared the results from the two types of software with the annotated information to validate the methods.

Intron length distributions analysis

Using Perl script, we extracted the intron information of the 10 plant genomes from the genome annotation. Then, we counted the number and percentage of 3n, 3n + 1, and 3n + 2 of these 10 plants' intron length distributions.

Results and Discussion

A comparison of BLAT and Sim4cc

As a prerequisite, it was assumed that the intron annotated information was correct and complete. Then, the software's results were compared with the annotated information. Three sets of results of intron information were obtained: two sets from the software (BLAT and Sim4cc) and one set from the annotated information (Table 4).
Using BLAT, we found 99.35% and 99.87% of the introns of all rice and Arabidopsis annotated introns, respectively. These introns were almost all of the introns in the genome - that is, only 0.13% to 0.65% of the introns were not found. In contrast, by using Sim4cc, 95.15% to 98.98% of the introns were found (1.02% to 4.85% of the introns were lost) of all rice and Arabidopsis annotated introns. In summary, BLAT got more of the introns in a genome than Sim4cc. In light of this result, it seems as though that BLAT produces better results than Sim4cc.
We found 30,194 rice genes with at least one intron by BLAT, but the number was 30,177 according to the annotated information. Because the BLAT results were larger than the annotated results, the BLAT results must have predicted some new and different genes with introns. In the BLAT results, many short-length introns (less than 50 bp) were predicted, but in fact, these short-length introns were part of transcript sequences and were not real intron sequences. In contrast, Sim4cc detected 29,875 genes with introns, and all of these genes were contained in the annotation information. The predicted intron accuracy rate of Sim4cc was 100%. On accuracy, Sim4cc was better than BLAT.
If Sim4cc is used, the user has to splice a whole genome file to many files: one gene, one file. The computing process of Sim4cc was more complex than that of BLAT, and each time, Sim4cc only calculated one cDNA sequence to one gene sequence; so, the executing efficiency and speed are not high. In comparison, BLAT was easier and faster than Sim4cc.
In conclusion, BLAT and Sim4cc can be used to predict introns, but each of them has its advantages and disadvantages. The comparative results are summarized in Table 5. Sim4cc was a cross-species spliced alignment program. In our study, Sim4cc was used to find introns by comparing cDNA sequences and gene sequences. The correct intron can be obtained by comparing one cDNA sequence with its own gene sequence. But, a lot of introns were lost by Sim4cc. In other words, Sim4cc was good at detecting the correct intron but not at predicting the whole number of introns in a genome. In contrast, BLAT can predict most of the introns - nearly all of the total introns in a genome. But, there were some false-positive predictions of introns. However, the proportion of this error was very small. As a result, BLAT will be proposed to annotate plant genome introns.

Intron length distribution of 10 plants

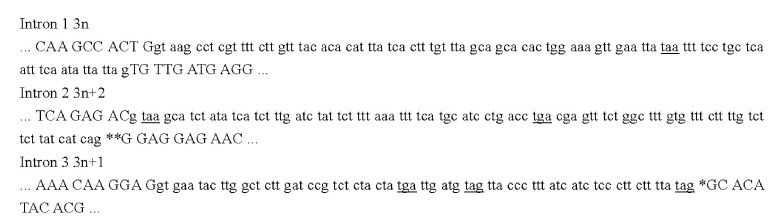
According to Roy's method, many predicted introns in the plant genomes had in-frame stop codons, and the predicted introns in these genomes were equally as likely to be a multiple of 3 bp (3n) as to contain a plus one (3n + 1) or two (3n + 2) bp. Here was an example of three phases from an Arabidopsis thaliana gene, AT1G17600.1 (Fig. 2).
By analyzing genome sequence annotations, we got three-phase intron distributions for 10 plant species (Table 6). If the plant intron annotation is more accurate, the number of three phases should be similar (one-third each). For 80% (8/10) of species, there were similar numbers of the three phases. It should be noted that most of these plant species annotations were the best annotations to date, but new annotations will be continually released to correct errors and false-positive results.

Two-species 3n intron skew analysis

For all of the 10 genomes (Table 6), there were very similar numbers of 3n + 1 and 3n + 2 introns, and the percentages of 3n + 1 and 3n + 2 introns were within 0.8%. In contrast, the number of 3n introns varied much more widely, from 29.1% to 47.7%. In this study, two species' genome introns showed strongly skewed percentages, in that the 3n intron percentage was much lower or higher than the expected value (one-third). Such a skew suggests systematic errors in the intron prediction.
The green alga Ostreococcus lucimarinus has one of the highest gene densities known in eukaryotes, with many introns [28]. There was a striking excess of predicted 3n introns (47.7% of all predicted introns, 1,130) compared to 3n + 1 (25.8%, 611) and 3n + 2 (26.5%, 628) introns. In this case, many predicted 3n introns were not true introns but instead exons.
The unicellular green alga Ostreococcus tauri is the world's smallest free-living eukaryote known to date [29]. These predicted introns showed a deficit of 3n introns (29.1%, 1,262), much lower than 3n + 1 (35.8%, 1,553) and 3n + 2 (35%, 1,519) introns. This result is very close to previous studies [18]. In this case, 3n introns may be mistakenly regarded as coding sequences, whereas a 3n + 1 or 3n + 2 intron may be inferred from the disruption of the coding frame.

Concluding remarks

By comparing the advantages and disadvantages of BLAT and Sim4cc in intron prediction, we found that BLAT is faster and can predict more introns than Sim4cc. Through using intron length distribution to detect introns' annotations, it is a simple and fast method for detecting a variety of possible systematic biases in intron prediction or even for detecting problems with genome assemblies.

Acknowledgments

This study was funded by the Korea Science and Engineering Foundation, the National Natural Science Foundation of China (No. 30900780), the China Postdoctoral Science Foundation (No. 20090461260 & No. 201104647), and the Postdoctoral Foundation of Shandong Agricultural University (No. 76267).

References

1. Purdom E, Simpson KM, Robinson MD, Conboy JG, Lapuk AV, Speed TP. FIRMA: a method for detection of alternative splicing from exon array data. Bioinformatics 2008;24:1707–1714. PMID: 18573797.
crossref pmid pmc
2. Zhou L, Pertea M, Delcher AL, Florea L. Sim4cc: a cross-species spliced alignment program. Nucleic Acids Res 2009;37:e80. PMID: 19429899.
crossref pmid pmc
3. Harrington ED, Bork P. Sircah: a tool for the detection and visualization of alternative transcripts. Bioinformatics 2008;24:1959–1960. PMID: 18635569.
crossref pmid
4. Rambaldi D, Felice B, Praz V, Bucher P, Cittaro D, Guffanti A. Splicy: a web-based tool for the prediction of possible alternative splicing events from Affymetrix probeset data. BMC Bioinformatics 2007;8(Suppl 1):S17. PMID: 17430561.
crossref pmid pmc
5. Mitchell RA, Castells-Brooke N, Taubert J, Verrier PJ, Leader DJ, Rawlings CJ. Wheat Estimated Transcript Server (WhETS): a tool to provide best estimate of hexaploid wheat transcript sequence. Nucleic Acids Res 2007;35:W148–W151. PMID: 17439966.
crossref pmid pmc
6. Lazzarato F, Franceschinis G, Botta M, Cordero F, Calogero RA. RRE: a tool for the extraction of non-coding regions surrounding annotated genes from genomic datasets. Bioinformatics 2004;20:2848–2850. PMID: 15117758.
crossref pmid
7. Milanesi L, Rogozin IB. ESTMAP: a system for expressed sequence tags mapping on genomic sequences. IEEE Trans Nanobioscience 2003;2:75–78. PMID: 15382662.
crossref pmid
8. Wang K, Singh D, Zeng Z, Coleman SJ, Huang Y, Savich GL, et al. MapSplice: accurate mapping of RNA-seq reads for splice junction discovery. Nucleic Acids Res 2010;38:e178. PMID: 20802226.
crossref pmid pmc
9. Dimon MT, Sorber K, DeRisi JL. HMMSplicer: a tool for efficient and sensitive discovery of known and novel splice junctions in RNA-Seq data. PLoS One 2010;5:e13875. PMID: 21079731.
crossref pmid pmc
10. Foissac S, Bardou P, Moisan A, Cros MJ, Schiex T. EUGENE'HOM: A generic similarity-based gene finder using multiple homologous sequences. Nucleic Acids Res 2003;31:3742–3745. PMID: 12824408.
crossref pmid pmc
11. Kent WJ. BLAT: the BLAST-like alignment tool. Genome Res 2002;12:656–664. PMID: 11932250.
crossref pmid pmc
12. Lee C, Atanelov L, Modrek B, Xing Y. ASAP: the Alternative Splicing Annotation Project. Nucleic Acids Res 2003;31:101–105. PMID: 12519958.
crossref pmid pmc
13. Odenwald WF, Rasband W, Kuzin A, Brody T. EVOPRINTER, a multigenomic comparative tool for rapid identification of functionally important DNA. Proc Natl Acad Sci U S A 2005;102:14700–14705. PMID: 16203978.
crossref pmid pmc
14. Castrignanò T, De Meo PD, Grillo G, Liuni S, Mignone F, Talamo IG, et al. GenoMiner: a tool for genome-wide search of coding and non-coding conserved sequence tags. Bioinformatics 2006;22:497–499. PMID: 16267081.
crossref pmid
15. Tamaki S, Arakawa K, Kono N, Tomita M. Restauro-G: a rapid genome re-annotation system for comparative genomics. Genomics Proteomics Bioinformatics 2007;5:53–58. PMID: 17572364.
crossref pmid pmc
16. Kent WJ, Zahler AM. The intronerator: exploring introns and alternative splicing in Caenorhabditis elegans. Nucleic Acids Res 2000;28:91–93. PMID: 10592190.
crossref pmid pmc
17. Irimia M, Roy SW. Spliceosomal introns as tools for genomic and evolutionary analysis. Nucleic Acids Res 2008;36:1703–1712. PMID: 18263615.
crossref pmid pmc
18. Roy SW, Penny D. Intron length distributions and gene prediction. Nucleic Acids Res 2007;35:4737–4742. PMID: 17617639.
crossref pmid pmc
19. Swarbreck D, Wilks C, Lamesch P, Berardini TZ, Garcia-Hernandez M, Foerster H, et al. The Arabidopsis Information Resource (TAIR): gene structure and function annotation. Nucleic Acids Res 2008;36:D1009–D1014. PMID: 17986450.
crossref pmid
20. Goff SA, Ricke D, Lan TH, Presting G, Wang R, Dunn M, et al. A draft sequence of the rice genome (Oryza sativa L. ssp. japonica). Science 2002;296:92–100. PMID: 11935018.
crossref pmid
21. Yu J, Hu S, Wang J, Wong GK, Li S, Liu B, et al. A draft sequence of the rice genome (Oryza sativa L. ssp. indica). Science 2002;296:79–92. PMID: 11935017.
crossref pmid
22. Schnable PS, Ware D, Fulton RS, Stein JC, Wei F, Pasternak S, et al. The B73 maize genome: complexity, diversity, and dynamics. Science 2009;326:1112–1115. PMID: 19965430.
crossref pmid
23. Paterson AH, Bowers JE, Bruggmann R, Dubchak I, Grimwood J, Gundlach H, et al. The Sorghum bicolor genome and the diversification of grasses. Nature 2009;457:551–556. PMID: 19189423.
crossref pmid
24. Han YH, Zhang ZH, Liu JH, Lu JY, Huang SW, Jin WW. Distribution of the tandem repeat sequences and karyotyping in cucumber (Cucumis sativus L.) by fluorescence in situ hybridization. Cytogenet Genome Res 2008;122:80–88. PMID: 18931490.
crossref pmid
25. Merchant SS, Prochnik SE, Vallon O, Harris EH, Karpowicz SJ, Witman GB, et al. The Chlamydomonas genome reveals the evolution of key animal and plant functions. Science 2007;318:245–250. PMID: 17932292.
crossref pmid pmc
26. Palenik B, Grimwood J, Aerts A, Rouzé P, Salamov A, Putnam N, et al. The tiny eukaryote Ostreococcus provides genomic insights into the paradox of plankton speciation. Proc Natl Acad Sci U S A 2007;104:7705–7710. PMID: 17460045.
crossref pmid pmc
27. Young ND, Cannon SB, Sato S, Kim D, Cook DR, Town CD, et al. Sequencing the genespaces of Medicago truncatula and Lotus japonicus. Plant Physiol 2005;137:1174–1181. PMID: 15824279.
crossref pmid pmc
28. Lanier W, Moustafa A, Bhattacharya D, Comeron JM. EST analysis of Ostreococcus lucimarinus, the most compact eukaryotic genome, shows an excess of introns in highly expressed genes. PLoS One 2008;3:e2171. PMID: 18478122.
crossref pmid pmc
29. Derelle E, Ferraz C, Rombauts S, Rouzé P, Worden AZ, Robbens S, et al. Genome analysis of the smallest free-living eukaryote Ostreococcus tauri unveils many unique features. Proc Natl Acad Sci U S A 2006;103:11647–11652. PMID: 16868079.
crossref pmid pmc
Fig. 1
Flowchart of a comparison of BLAT and Sim4cc results in predicting introns. Intron information, including the following information of one intron: gene name, intron number, intron position in the gene, intron length, intron position in the genome, forward-exon length, backward-exon length, and intron sequences. BLAT, Blast-Like Alignment Tool.
gni-10-58-g001.jpg
Fig. 2
An example of three phases of intron from an Arabidopsis gene, AT1G17600.1. Upper/lowercase sequence indicates exon/intron sequence. Asterisks indicate frameshifts introduced by non-3n introns; intronic in-frame stop codons are underlined. Intron 1 is a 99-bp intron (3n) with one in-frame stop codon. Intron 2 is a 100-bp intron (3n + 2), which has two in-frame stop codons and thus does not interrupt the open reading frame. Intron 3 is a 74-bp intron (3n + 1) with three stop codons.
gni-10-58-g002.jpg
Table 1.
List of intron databases
Species Note Website
Arabidopsis Seven eukaryotic organisms http://66.170.16.154/ExDom/.
Eukaryotic Group I intron sequence and structure database http://www.rna.whu.edu.cn/gissd/
Human Adatabase resource for alternative splicing analysis http://www.caspur.it/ASPicDB
Wheat Atool to provide best estimate of hexaploid wheat transcript sequence http://www4.rothamsted.bbsrc.ac.uk/whets.
15 animal Analysis and comparative genomics of alternative splicing in 15 animal species http://www.bioinformatics.ucla.edu/ASAP2
Rice and Arabidopsis Genomewide comparative analysis of alternative splicing in plants http://www.plantgdb.org/ASIP
Mammalian Abioinformatics resource on alternative splicing http://www.ebi.ac.uk/asd
Eukaryotic Advances in the Exon-Intron Database http://www.meduohio.edu/bioinfo/eid/
Human andmouse Transcript pattern variants annotated for both alternative splicing and alternative polyadenylation http://www.ebi.ac.uk/atd/
Human Adatabase for genome-wide alternative splicing event detection using large scale ESTs and mRNAs http://avatar.iecs.fcu.edu.tw/
Mammalian The Alternative Splicing Database http://www.ebi.ac.uk/asd
Eukaryotic Adatabase for 'intronless' genes in eukaryotic genomes http://sege.ntu.edu.sg/wester/intronless
Nine eukaryotic Extended Alternatively Spliced EST Database http://eased.bioinf.mdc-berlin.de/.
Human Genome wide identification and classification of alternative splicing based on EST data http://splicenest.molgen.mpg.de
Eukaryotic Database of eukaryotic protein-encoding genes http://origin.bic
Mammalian The Alternative Splicing Annotation Project http://www.bioinformatics.ucla.edu/ASAP
Bacteria andlower eukaryotic Database for mobile group II introns http://www.fp.ucalgary.ca/group2introns
NCBI Taxonomy Database A web-site for intron statistics http://www.icgeb.trieste.it/introns
Eukaryotic An exon-intron database http://intron.bic.nus.edu.sg/exint/newexint/exint.html.
Organellar Functional genomics of organellar introns database http://wnt.cc.utexas.edu/~ifmr530/introndata/main.htm
Eukaryotic Generation of a database containing discordant intron positions in eukaryotic genes http://intron.bic.nus.edu.sg/midb/midb.html
Mammalian Database of canonical and non-canonical mammalian splice sites http://www.softberry.com/spldb/SpliceDB.html
Eukaryotic Intron sequence and evolution databases http://nutmeg.bio.indiana.edu/intron/index.html
Eukaryotic The exon-intron database-an exhaustive database of protein-coding intron-containing genes http://mcb.harvard.edu/gilbert/EID
Eukaryotic An exon/intron database http://intron.bic.nus.edu.sg/exint/exint.html
Yeast The yeast intron database http://www.embl-heidelberg
Caenorhabditis elegans The intronerator: exploring introns and alternative splicing in Caenorhabditis elegans http://www.cse.ucsc.edu/approximatelykent/intronerator/

EST, espressed sequence tag.

Table 2.
Tools for detection alternative-splicing/introns
Tools name Description Reference
FIRMA A method for detection of alternative splicing from exon array data Purdom et al. [1]
Sim4cc A cross-species spliced alignment program Zhou et al. [2]
Sircah A tool for the detection and visualization of alternative transcripts Harrington and Bork [3]
Splicy A web-based tool for the prediction of possible alternative splicing events from Affymetrix probeset data Rambaldi et al. [4]
WhETS A tool to provide best estimate of hexaploid wheat transcript sequence Mitchell et al. [5]
RRE A tool for the extraction of non-coding regions surrounding annotated genes from genomic datasets Lazzarato et al. [6]
ESTMAP A system for expressed sequence tags mapping on genomic sequences Milanesi and Rogozin [7]
MapSplice Accurate mapping of RNA-seq reads for splice junction discovery Wang et al. [8]
HMMSplicer A tool for efficient and sensitive discovery of known and novel splice junctions in RNA-Seq data Dimon et al. [9]
EUGÈNE'HOM A generic similarity-based gene finder using multiple homologous sequences Foissac et al. [10]
BLAT The BLAST-like alignment tool Kent [11]
ASAP A novel method to predict the exon-intron structure of a gene that is optimally compatible to a set of transcript sequences Lee et al. [12]
EVOPRINTER A multigenomic comparative tool for rapid identification of functionally important DNA Odenwald et al. [13]
GenoMiner A tool for genome-wide search of coding and non-coding conserved sequence tags Castrignanò et al. [14]
Restauro-G A rapid genome re-annotation system for comparative genomics Tamaki et al. [15]
Scan Intron Scan a database of introns confirmed by cDNA/EST alignments for patterns at either end Kent and Zahler [16]

BLAT, Blast-Like Alignment Tool.

Table 3.
Ten plant species genome sequence sources
Species Version Source Reference
Arabidopsis thaliana TAIR, version 10 http://www.arabidopsis.org/ Swarbreck et al. [19]
Oryza sativa L. ssp. japonica Release 7 http://rice.plantbiology.msu.edu/ Goff et al. [20]
Oryza sativa L. ssp. indica 28 Oct, 2008 http://rice.genomics.org.cn/ Yu et al. [21]
Zea mays B73_RefGen_v2 http://www.maizegdb.org/ Schnable et al. [22]
Sorghum bicolor Version 1.0 http://www.phytozome.net/sorghum.php Paterson et al. [23]
Cucumis sativus 7 April, 2011 http://cucumber.genomics.org.cn/ Han et al. [24]
Chlamydomonas reinhardtii Version 4.0 http://genome.jgi-psf.org/Chlre4/ Merchant et al. [25]
Ostreococcus lucimarinus Version 2.0 http://genome.jgi-psf.org/Ost9901_3/ Palenik et al. [26]
Ostreococcus tauri Version 2.0 http://genome.jgi-psf.org/Ostta4 Palenik et al. [26]
Medicago truncatula Mt3.5.1 http://www.medicago.org/ Young et al. [27]
Table 4.
Compared BLAT and Sim4cc predicted intron information with annotated intron information
Species Annotated
BLAT
Sim4cc
Intron No. Gene No. Gene (with intron)
Intron
Gene (with intron)
Intron
Gene (with intron)
No. % No. % No. % No. % No. %
Rice 251,812 56,797 44,796 78.87 250,178 99.35 44,370 78.12 239,590 95.15 42,577 74.96
Arabidopsis 175,513 41,671 30,177 72.42 175,285 99.87 30,194 72.46 173,715 98.98 29,875 71.69

BLAT, Blast-Like Alignment Tool.

Table 5.
Comparative comparison of BLAT and Sim4cc in intron prediction
Tools False-positive (%) False-negative (%) Accuracy (%) Operability Running time
BLAT 0.38 0.39 99.62 Easy Fast
Sim4cc 0 2.94 100 Complex Slow

Note: In this table, the data is the average of two model plants (Arabidopsis and rice).

BLAT, Blast-Like Alignment Tool.

Table 6.
Intron three-phase distributions of 10 plant species
Species Intron No. 3n 3n + 1 3n + 2 Excess 3n (3n + 1) - (3n + 2)
Arabidopsis thaliana 175,513 0.333 0.334 0.334 0.001 0.000
Oryza sativa L. ssp. japonica 251,812 0.353 0.322 0.324 -0.030 -0.002
Oryza sativa L. ssp. indica 127,029 0.329 0.335 0.335 0.006 0.000
Zea mays 266,772 0.331 0.335 0.334 0.003 0.001
Sorghum bicolor 115,610 0.336 0.334 0.331 -0.004 0.003
Cucumis sativus 90,434 0.331 0.334 0.335 0.003 0.000
Chlamydomonas reinhardtii 104,660 0.355 0.323 0.322 -0.033 0.001
Ostreococcus lucimarinus 2,369 0.477 0.258 0.265 -0.215 -0.007
Ostreococcus tauri 4,334 0.291 0.358 0.350 0.063 0.008
Medicago truncatula 152,466 0.331 0.336 0.333 0.004 0.002
TOOLS
Share :
Facebook Twitter Linked In Google+
METRICS Graph View
  • 0 Crossref
  •    
  • 5,012 View
  • 51 Download
Related articles in GNI


ABOUT
ARTICLE CATEGORY

Browse all articles >

BROWSE ARTICLES
FOR CONTRIBUTORS
Editorial Office
Room No. 806, 193 Mallijae-ro, Jung-gu, Seoul 04501, Korea
Tel: +82-2-558-9394    Fax: +82-2-558-9434    E-mail: kogo3@kogo.or.kr                

Copyright © 2024 by Korea Genome Organization.

Developed in M2PI

Close layer
prev next