Introduction
It is widely accepted that mutation is the main causal factor for diverse tumorigenesis [1, 2]. The recent development of next-generation sequencing (NGS) technologies has revolutionized the speed and throughput of DNA sequencing, which facilitates the discovery of new driver mutations [3]. For example, the ARID1A gene is mutated in 83% of gastric cancers with microsatellite instability and the SF3B1 gene is somatically mutated in 9.7% of chronic lymphocytic leukemia patients [4, 5]. In colorectal cancers, although the majority of recurrent mutations have been previously known, some novel mutations, such as the mutations in the SOX9 and FAM123B genes, were also identified by NGS technology, which may have implications for colorectal tumorigenesis [6]. In melanoma, approximately 40% was found to have causal mutations affecting B-Raf function [7]. Along with the well-known driver mutations, the novel mutations identified by NGS will be useful for predicting the prognosis and molecular characterization of cancers [8, 9].
Recently, a number of mutation calling tools, such as VarScan [10], Genome Analysis ToolKit [11], and MuTect [12], have been developed to detect single-nucleotide variants (SNVs) or indels from NGS data. However, SNV calling from a single cancer case is not the final step for defining clinically meaningful mutations. To define the pathogenic SNVs in human cancers, a commonly used approach is to identify the phenotype-associated recurrent mutations in the study group. Due to the data size burden of NGS output, profiling the mutations associated with a certain phenotype or prognosis in a study group by a researcher who does not have a bioinformatics background or facilities is very difficult. Currently, there is no user-friendly tool supporting methods for the detection of recurrent or phenotype-specific mutations.
In this study, in order to support the definition of recurrent mutations or phenotype-specific mutations from NGS data of a group of cancers with diverse phenotypes, we aimed to develop a user-friendly tool, named mutation arranger for defining phenotype-related SNV (MAP).
Description
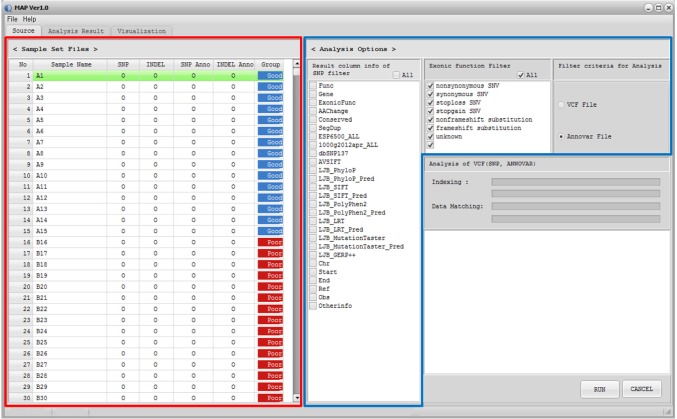
MAP software was designed as a standalone program, compatible in Microsoft Windows environments with a user-friendly graphic interface, and compiled codes of MAP can be easily installed. Both Variant Call Format [13] and its annotation files, such as ANNOVAR output [14], can be used as input files for MAP. When a user loads the input file, called Sample Descriptor file (GSF), MAP software displays the sample set information and filter options (Fig. 1). Once data are loaded, the user can filter the data using the 'Analysis Options' tab in MAP software based on annotation information. By using the sample set and analysis options, MAP software generates the summary metrics for multiple samples. Summary metrics include the mutation status for each sample, total mutation frequency, p-values for differences between phenotype groups based on clinical information, genomic position, reference/observed sequence, and additional information, such as read depth by default. MAP software also displays more detailed information in summary metrics based on the user-selected 'Analysis Options.' In the 'Analysis Result' tab, MAP software provides the frequency- or p-value-based filter function. This functionality supports detection of the recurrent mutations in study subjects and identification of the phenotype-specific mutation that occurs significantly in a certain phenotypic subclass. Then, MAP software represents the user-selected mutations graphically in the 'Visualization' tab. To sort the variants by genomic position, p-value, or frequency, users can use the sort function in the 'Analysis Result' tab. Details of the program download, installation, and analysis procedures are available in the user manual.
Prerequisites
Mutation calling files from Genome Analysis ToolKit [11] can be used directly as input files for 'Sample Descriptor.' Alternatively, manually prepared standard Variant Call Format [13] is also available. Annotation information files, such as ANNOVAR outputs, can be used as input files for Sample Descriptor. GSF is a comma-separated values text file that describes the input files, such as GATK output files and ANNOVAR output files, and phenotype information. MAP imports this Sample Descriptor file as the input file. Details are available in the user manual.
Generation of summary metrics
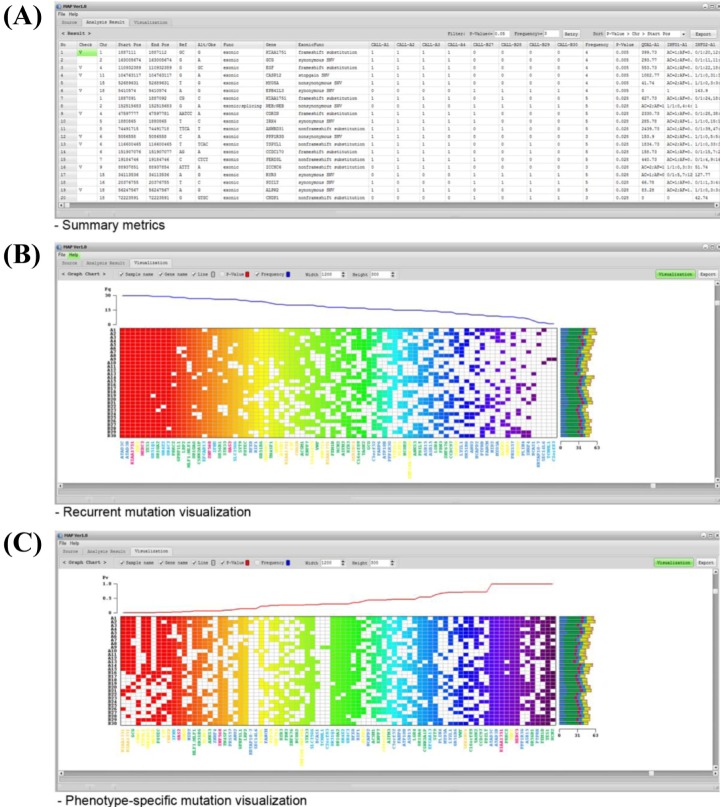
When users load the input file, MAP software displays the sample set information and filter options in the 'Source' tab. If any file is not prepared properly, MAP software informs the user in the 'Sample Set Files' tab. After data are loaded, the user can filter the data using the 'Analysis Option' tab based on annotation information. MAP software supports eight filter options for exonic function. By using the mutation calls of each sample, MAP generates the summary metrics (Fig. 2A). Based on user-selected filters in the 'Analysis Options' tab, summary metrics represent additional annotation information, such as gene name, function, known variant, and amino acid change. The additional annotations can be hidden using the SNP filter option in the 'Analysis Option' tab. These mutation metrics are exported into a comma-separated values text file for further investigation.
Determination of recurrent or phenotype-specific mutations
In the 'Analysis Result' tab, MAP software defines the recurrent mutations in study subjects by frequency. The frequency threshold can be determined arbitrarily by the user in the 'Frequency Filter' function. MAP also defines the phenotype-specific mutations using the mutation metrics and phenotype information. Phenotype-specific mutations that occur more frequently in one of two clinical conditions (e.g., drug-responder vs. non-responder) are determined by chi-square test under the user-defined significance level.
Visualization
The graphic user interface is implemented in the software for users to easily handle large-scale data or access the analysis result (Fig. 2B and 2C). The recurrent or phenotype-specific mutations can also be demonstrated visually in heat-map style. Furthermore, MAP software can support the visualization for additional information at a time. For example, the left and right of the heat-map represent the sample name and mutational spectrum, respectively. The bottom of the heat-map represents the gene name by color for mutational spectrum. Frequency or p-value plots are represented on top of the heat-map (Fig. 2B and 2C). This graphical result can be exported into an image file for further investigation.
Conclusion
MAP is a user-friendly program with multiple functions that supports the determination of recurrent or phenotype-specific mutations and provides graphic illustration images to the users. Its operation environment, Microsoft Windows, enables more researchers who cannot operate Linux to define clinically meaningful mutations with NGS data from cancer cohorts.