Introduction
Human tissue-derived cell lines have served as an effective platform for understanding the molecular biology of diseases and increasingly for drug discovery [1, 2]. For wholesale analysis of gene sets or chemical compound files, cell line-based high-throughput screening is typically performed on a well-to-well basis in high-density microtiter plates. From this, significant changes in cellular phenotype by each perturbation in a given library compared to mock controls or other samples are identified. Examples of perturbations include synthetic small molecules, natural products, cDNA expression libraries, and, of primary focus here, genomewide collections of short interfering RNAs (siRNAs). It is a truism that cell-based screens are highly vulnerable to environmental variations. In particular, siRNA screens involve multiple processing steps employing automatic or semiautomatic liquid-handling equipment carried out over many days. Each step introduces position-specific variables and distinct operational failures. This, combined with unavoidable batch effects from cell cultures and reagent efficacy, can introduce asymmetric phenotypic variation that is independent of the perturbations of interest. Accounting for and correcting this variation is well recognized as an essential component of successful high-throughput screening.
Statistical methods to process whole-genome siRNA screen data have been reported by others [3, 4], but limited open-source tools are currently available [3, 5, 6]. Moreover, as most available open-source tools are written in R/bioconductor [3, 6], modifications that require screen-specific command lines are challenging without prior experience in script programming. Very recently, a web-based tool (web cellHTS2) and its standalone package [5] have been published. However, they either run on a remote server or require other specialized preinstalled software.
Here, we present siMacro, a GUI-based simple tool for processing cell-based high-throughput screening datasets. siMacro has been implemented in Visual Basic for Applications (VBA) and packaged as a Microsoft Office Excel add-in. It allows one-step, fast, and easy suppression of outlier values; normalization; and standardization of a complete raw dataset from a genomewide siRNA screen in an intuitive spreadsheet format. The tool processes the data points associated with a 2-condition genomewide screen with biological triplicates on a standard laptop computer in less than 1 minute.
Methods and Implementation
Procedure of data processing
Prerequisite
We assume the screen was done in 96- or 384-well plates and passed the standard quality control metric (by Z or Z' factor, for example). siMacro is robust against sporadic bad wells from triplicate experiments but will not censor an entire plate compromised by massive failure, such as broad contamination. We also assume siRNAs in the library plate are randomly distributed, which is generally true for most commercially available genomewide siRNA libraries. siMacro currently supports 1- or 2-condition screens.
Input data
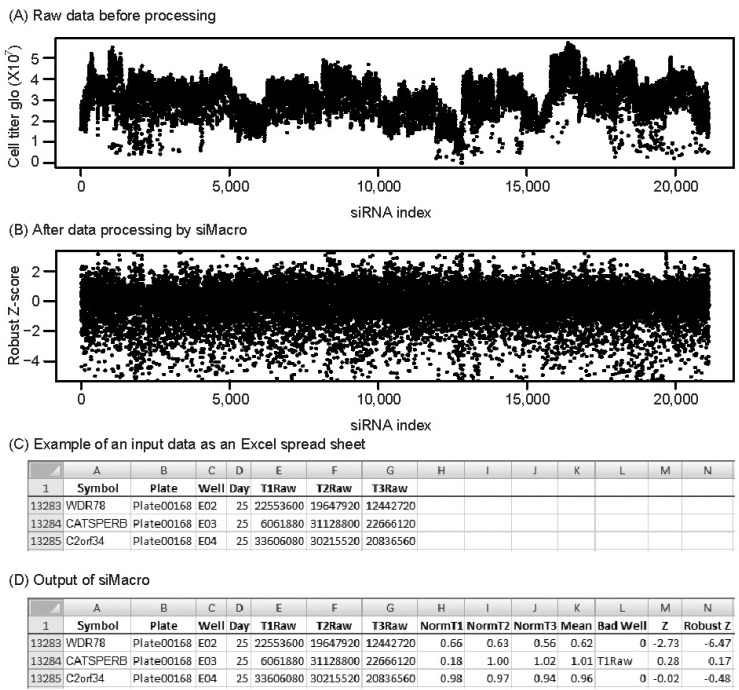
siMacro requires all the individual plate readouts be put into an Excel spreadsheet with the field headers: day or cell batch, plate name, well name, and raw data columns per siRNA or a pool (Fig. 1C). siMacro allows only numerical data field values except for manually censored "bad" wells masked by 'NA.'
Normalization
Most popular normalization protocols employ either on-plate control-based or sample-based methods. Although there is no golden rule for this, we prefer the latter for most siRNA screens, as 1) cell-based siRNA screening is vulnerable to within-plate variation, such as an edge effect and column/row effects that are not corrected by on-board controls [4], and 2) because siRNA hits are often rare within a given test plate, the majority of samples proxies the mock control. Therefore, siMacro currently only supports normalization by samples at the resolution of a plate, row, and column. Depending on the cellular phenotype and experimental design, the optimal choice of resolution varies and can therefore be specified by the screener. If row or column effects are trivial or there are more than 10-30 hits per 96-well plate, a user can choose plate median normalization (default). As many liquid dispensers move row-wise, a row effect is very common in the siRNA screens. If the hits/plate is less than 10 per 96-well plate and accompanied by a significant row effect, row-median normalization is a better choice.
Censoring bad wells
Sporadic bad wells are often manually censored one by one, which is inefficient and error-prone in large-scale screens. If the experiment is done in triplicate or more, bad wells can be detected automatically by the inflated coefficient of variation (CV) among the replicates. siMacro identifies bad wells by applying a user-defined cutoff to the CV among normalized values from a replicate. The default is 1%, meaning 1% of the total genes with the highest CV will have a masked outlier well. This significantly reduces false positives but can also overcorrect. Therefore, siMacro reports flags for all genes with censored wells to aid user decisions with regard to exclusion from downstream analysis.
Standardization and hit scoring
A unified scoring scheme is employed that accounts for batch effects from multiday experiments. Under the assumption of normality, the Z-score, which indicates how many standard deviations an observation is away from the mean, is an intuitive scoring metric. However, it is sensitive to biological outliers (hits) in the data pool, resulting in deflated scores. An alternative is to use the robust Z-score, which is a measure of the median absolute deviation from the median. siMacro calculates the Z-score and the robust Z-score from the user-provided unit of experiment: e.g., the day, cell batch, or plate. siMacro takes the mean of log2-transformed normalized values from replicates for the calculation. For a 2-condition synthetic phenotype screen, the log2 ratio between the 2 conditions is used per siRNA to calculate the Z and the robust Z-scores for a synthetic effect. siMacro returns output, including individual and mean normalized values, Z-score, robust Z-score, and flags, for the censored bad wells directly onto the Excel data sheet as additional columns (Fig. 1D).
Implementation
The original source written in R is implemented in VBA and packaged as an Excel add-in. Since ease of use is the main objective of the plug-in, it provides simple GUI and depends only on Excel. As Excel is widely utilized and familiar to most biologists, siMacro provides an immediate option for dataset processing together with Excel-based data visualization tools. siMacro runs on Microsoft Office Excel 2007 or later for the Windows OS or Excel 2011 for the Mac OS. On a standard laptop computer with a Pentium dual-core 1.73 GHz processor and 1 GB memory, the operating time is under 60 seconds to process a triplicate 2-condition genomewide data set.
Example of Application
As a test set, the direct lethality dataset from 21,125 sets of siRNA oligos in a non-small cell lung cancer line, H1155 [7], was used. From raw data for cell viability (Fig. 1A), it was evident that there was a row effect and day-to-day variation in transfection efficiency as well as sporadic technical outliers due to contamination (e.g., T1Raw of siCATSPER in Fig. 1C). With the default 1% highest CV filter and row-median normalization, siMacro censored, normalized, and standardized the dataset (Fig. 1B and 1D). siMacro has been developed for but is not limited to cell-based genomewide siRNA screens.